Technical analysis of stocks and other financial markets is admittedly a “fuzzy” craft.
Identifying technical patterns is not that dissimilar from gazing at the clouds: depending on personal biases and how our brains are wired, different people can (and will) see different patterns.
Additionally, even “textbook” patterns can fail, often in direct proportion to how visible they are and how much attention they receive. Finally, it doesn’t help that the “true” pattern is only apparent in hindsight.
I will let the above serve as a disclaimer of sorts and proceed to tell you why I think the current price structure of the S&P 500 looks to me an awful lot like a seven-month bearish rising wedge pattern. I will also discuss the implications for future price direction.
Rising Wedge Defined
A rising wedge is a bearish continuation or reversal pattern, where the price movement happens in a series of higher highs and higher lows confined within two rising trendlines that converge toward an apex. Here is a graphical representation of the rising wedge pattern from www.aboutcurrency.com:
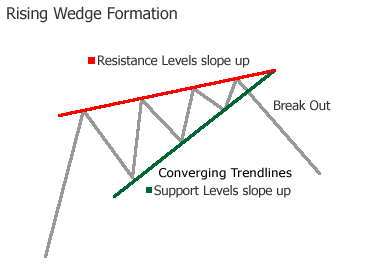
To learn more about this pattern and its many manifestations and implications, please see this excellent overview at ToTheTick (www.tothetick.com).
S&P 500 Rising Wedge Pattern Forming?
The initial point of this wedge pattern was at the October 2014 correction low, although the pattern itself could only be defined after the second higher high was established in late February (point #4 on the chart below).
The pattern confirmation grew a little stronger with the early March bounce off the lower rising trendline (point #5). Following last week’s unsuccessful attempt to push through the 2100 level, the price is now hugging the lower trendline and threatening to break down from the pattern. Note that there is still a bit more wiggle room for the pattern to evolve, but the window is narrowing.
The height of the pattern is measured by subtracting the initial low from the initial high and in this case it measures roughly 260 points.
At this point it is too soon to declare that the S&P is headed below the lower trend line. However, should this happen the initial measured move target forecasts a possible return to the 1820 area.
It’s important to note that the 1820 area would only be the “initial” downside target as most confirmed reversals out of rising wedge patterns lead to subsequent price moves that are lower than the pattern bottom.
It is obviously impossible to predict the future but should this pattern confirm it would mark a major top in the current bull market and possibly signal its end.
Finally, and as I mentioned above, all technical patterns have a risk of failure. This particular rising wedge pattern would be negated should the S&P push through the upper trendline around 2150.
Follow Drasko on Twitter: @NoanetTrader
No position in any of the mentioned securities at the time of publication. Any opinions expressed herein are solely those of the author, and do not in any way represent the views or opinions of any other person or entity.


