The Russell 2000 Index (RUT) has received some attention lately as it is still beneath its April highs. However, from a technical perspective the Russell 2000 is still in good shape.
Back in February, I wrote about the Russell 2000 Riding Its Bullish Channel Higher. It’s time for an update.
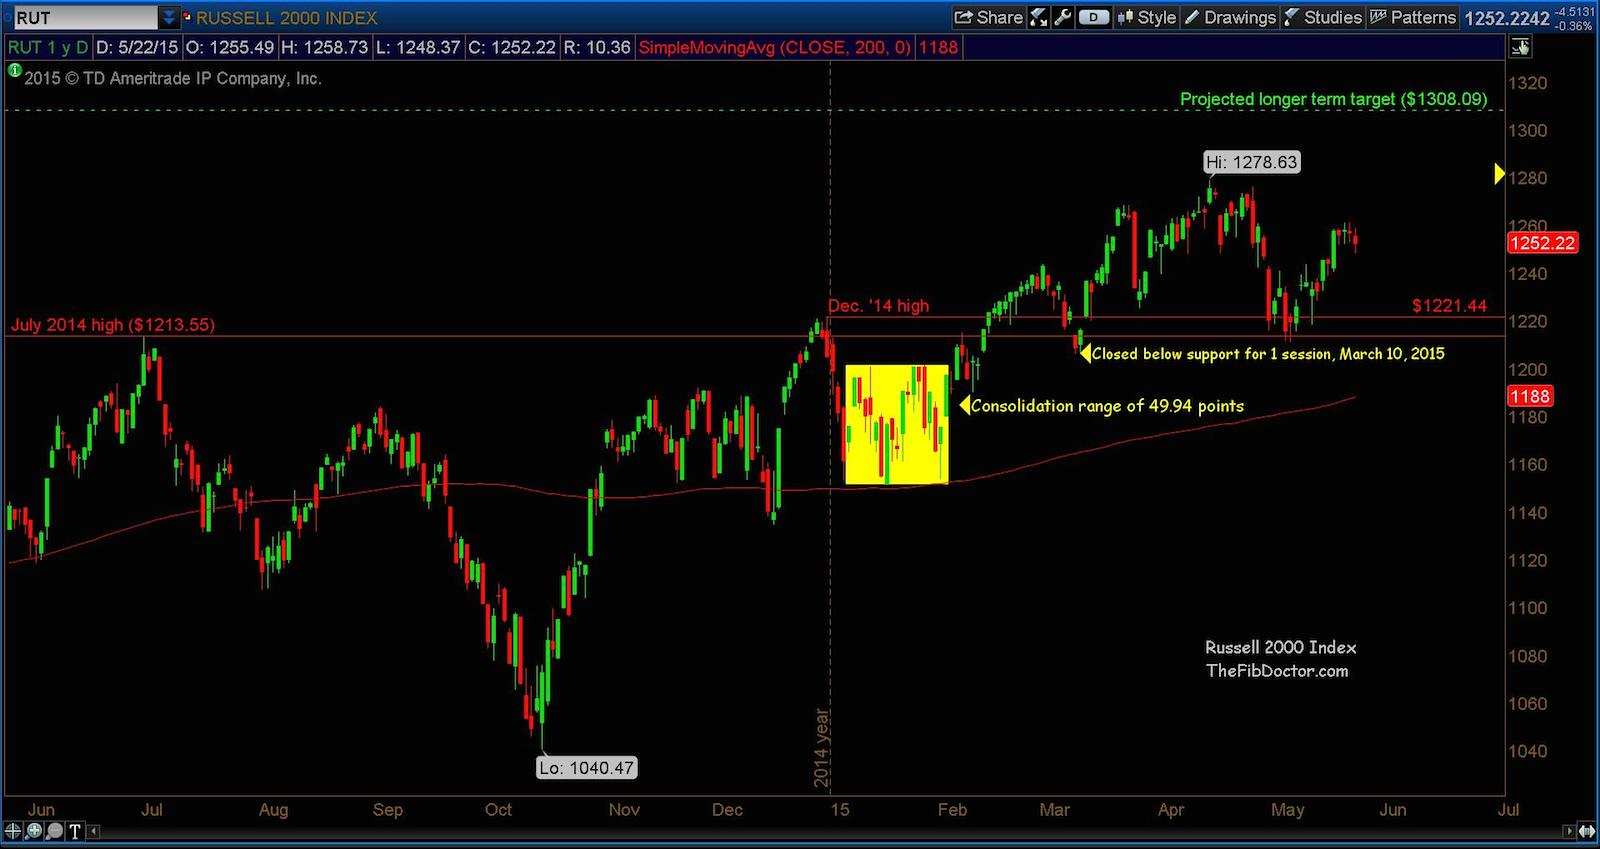
In the chart below, we can see that the RUT is well above near-term supports. As well, we still have an outstanding long term price target above current levels. Let’s review.
- After failing to hold above the July highs, the Russell 2000 Index declined 5.7 percent into January. It then consolidated in a 49.94 point range throughout the month of January 2015.
- Price then broke out of the January range and moved up +11.05%.
- I have identified 2 levels of resistance which are now support.
- The July 2014 high of 1213.55
- The December 2014 high of 1221.44
- Both support levels have been tested and held sans 1 day on March 10th, 2015.
- Longer term target is 1308.09.
Russell 2000 Index Daily Chart
Investors will look for price to build upon its recent rally. However, it should be noted that a pullback that pushes below the identified support levels would be reason for caution. Thanks for reading.
Follow Dave on Twitter: @TheFibDoctor
No position in any of the mentioned securities at the time of publication. Any opinions expressed herein are solely those of the author, and do not in any way represent the views or opinions of any other person or entity.


 and Semiconductors (SMH): Concerning Price Pattern?")


