The markets bounced higher last week and small cap stocks were one of the beneficiaries. The Russell 2000 Index (RUT) had a big week and is back testing its highs. So it’s time to take a look at what my Fibonacci method is saying.
I wrote about the strength of the Russell 2000 back in August, September, November and December of 2014. For reference, links to each of those articles are listed below:
Since that time, the Russell 2000, as well as the Dow Jones Industrial Average, NASDAQ Composite and the S&P 500 all reached resistance levels where they would either break out and continue to move higher or pull back and do some back-filling. The latter occurred with each index retreating 5.0 to 5.5%. Use this article from January 2015 for reference.
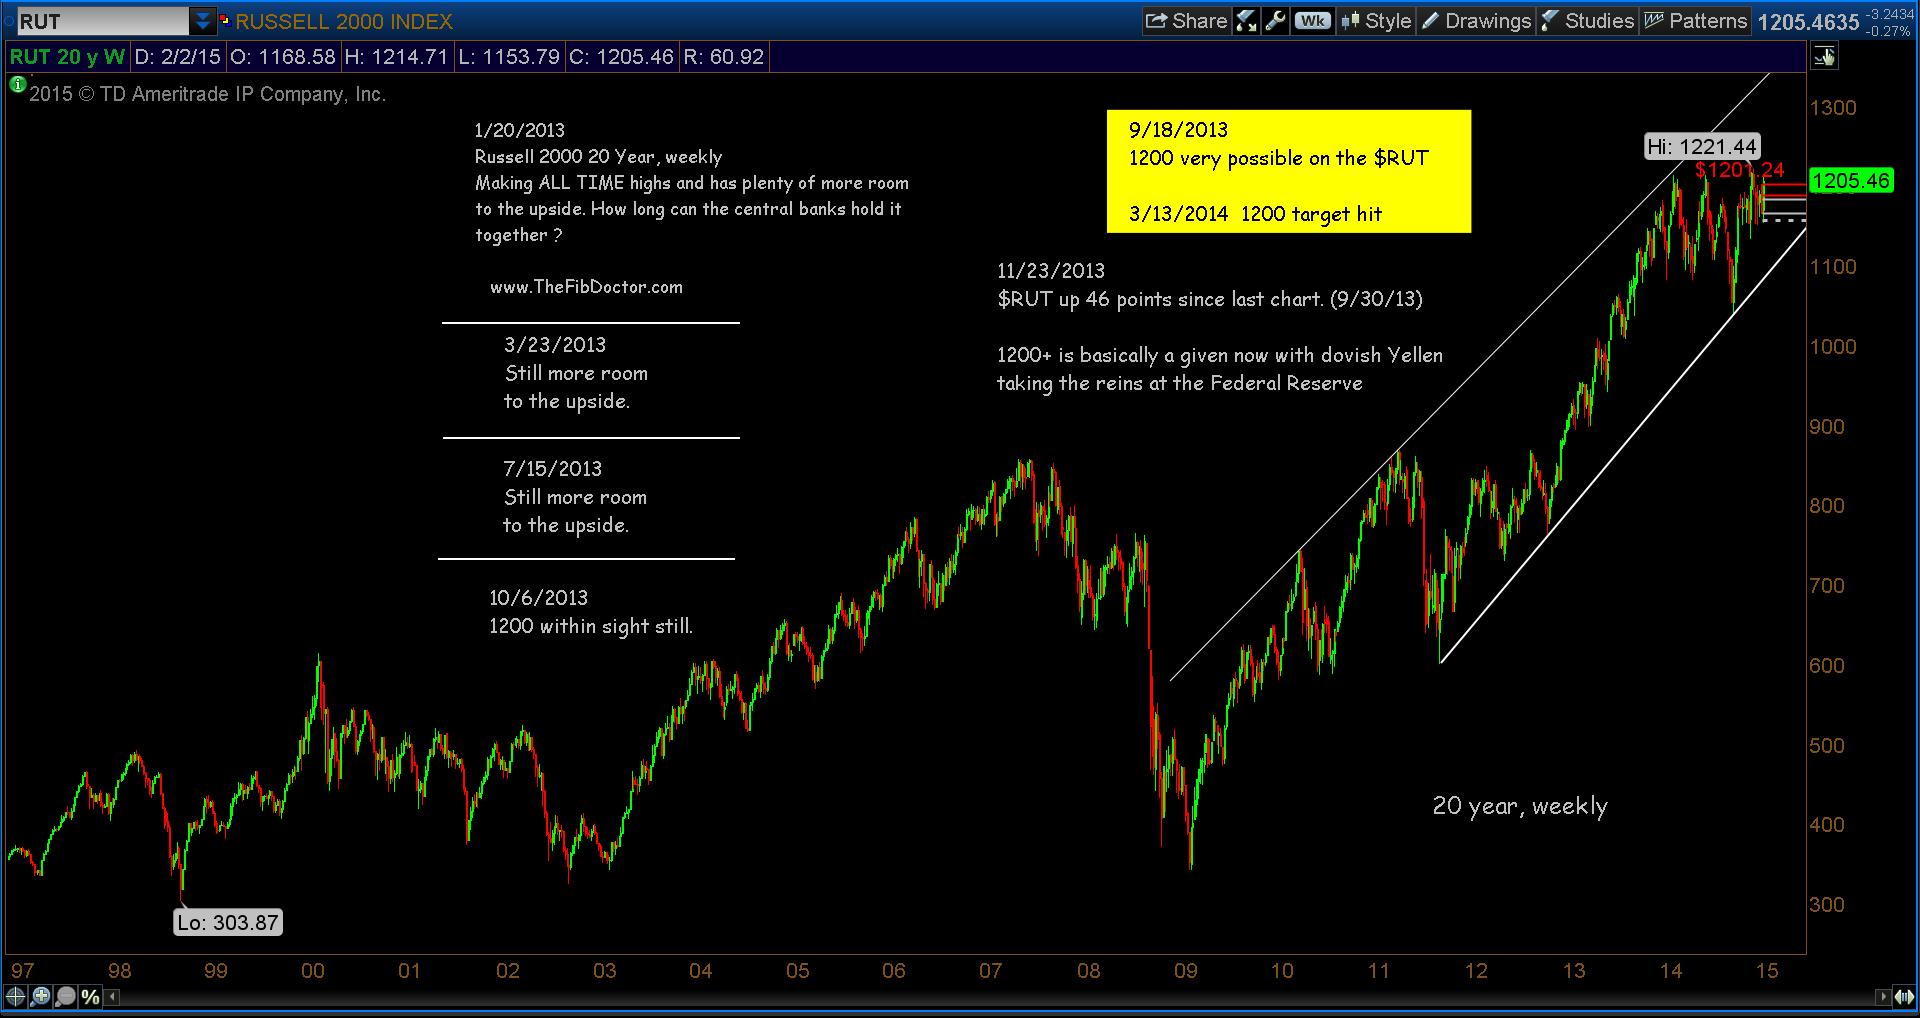
So where are we now concerning small cap stocks and the Russell 2000? Let’s take a look at some charts and see. I’ll start with a 17 year weekly overview to show that the Russell is still well within a strong uptrend channel. There’s still room both ways, but the channel is bullish, as is the current setup.
Russell 2000 (RUT) – 17-year Weekly Chart
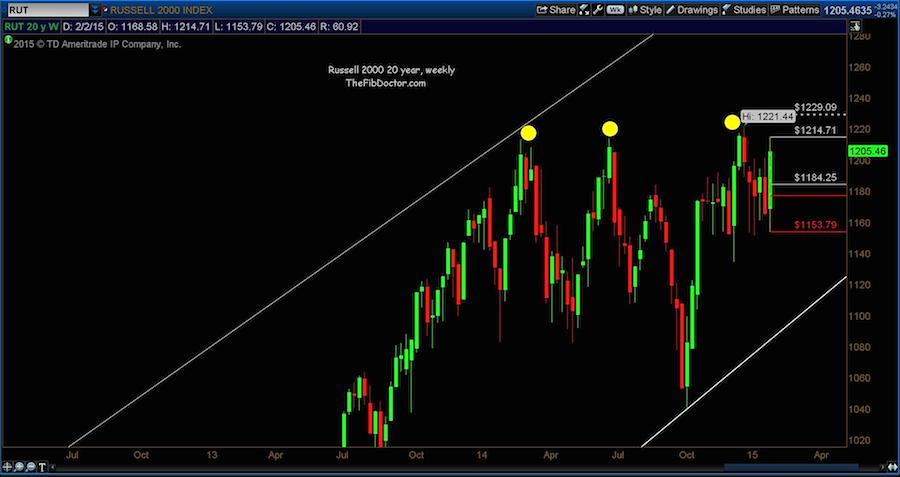
Now lets zoom in much tighter and see what Fibonacci is telling us. In the weekly “zoom” chart below, you’ll see price moved up to a point that created a new weekly target of 1229.
This is also a great opportunity to see that in October 2014 price pulled back precisely to the lower line of the up channel and then moved up an impressive 17.39%.
I’ve highlighted in yellow three previous highs that the Russell 2000 will need to clear in order to reach the target of 1229. A solid close above those levels is what you want to keep an eye on for now. If we see that, it will foretell of higher prices for small caps.
I still maintain that we will see a “13 handle” on the RUT some time in 2015.
Russell 2000 (RUT) 18-month Weekly Chart
Thanks for reading and always use a stop loss order!
Follow Dave on Twitter: @TheFibDoctor
No position in any of the mentioned securities at the time of publication. Any opinions expressed herein are solely those of the author, and do not in any way represent the views or opinions of any other person or entity.


