 Gold is getting tons of press recently and I’ve been blogging about the metals for a while. This post is going to go into some of the underlying math currently driving the PRICE action and how a case can be made that the $1050 to $1090 level is going to be very important for Gold prices.
And, even more interesting, this level could come into play around around the Christmas holidays.
Let’s start with a look at a historical chart of Gold prices highlighting the long-term bull market and subsequent bear correction.
Spot Gold Prices – Historical Chart
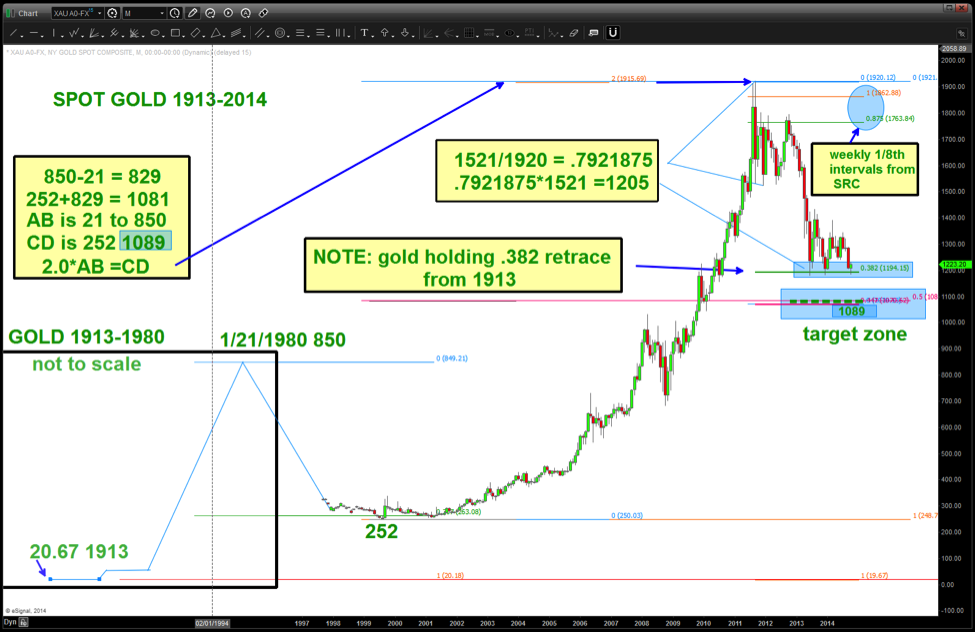
If we start from the left of the chart you will see a depiction of the Gold Prices from 1913-1980. (Note the time is NOT to scale.) The price of Gold was fixed in 1913 HOWEVER if you look to the current price levels, you’ll see that the 1195 area is the exact .382 retracement from that 1913 low. That is key because the fundamental frequency target came right in around 1904.
The fundamental frequency target is much like a rock hitting the water. The WAVE that the rock creates will depend on how high and how heavy the rock is when you drop it. That is why the initial impulse move is so important ….here’s the math:
- High 1921 // First low 1521
- 1521/1921 = .7921875
- .79218575*1521 = 1205 PRICE
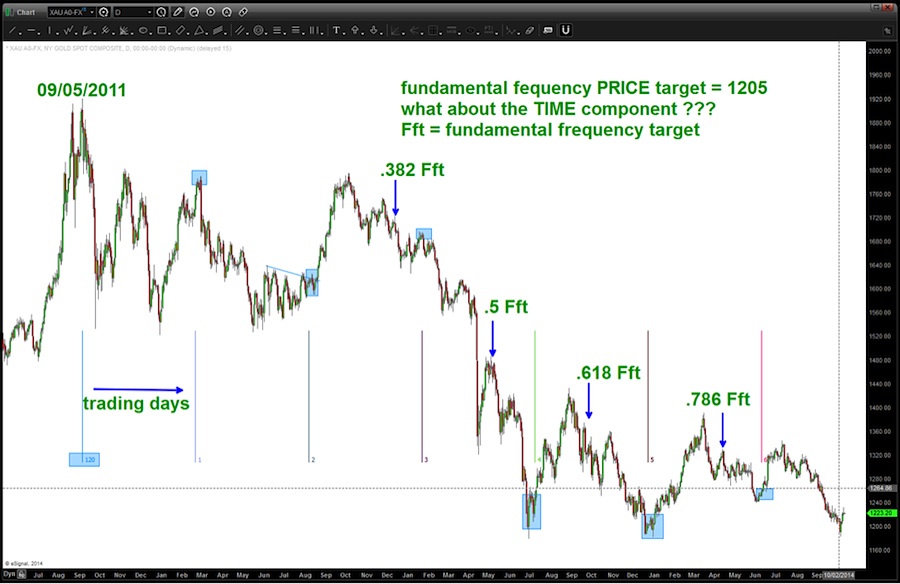
- Now, just an FYI, book mark Dec 24, 2014. That is 1205 calendar days from the all time high.
- In the chart below I just took the 1205 days and divided it into 10 and used 120 trading days. You could use solar days, 120 calendar days … but note the CYCLE present w/ the light blue rectangles. Very important turns in gold occurred w/ in a couple days of those 1/10 cycles.
- Also, just for fun I multiplied 1205*ratio’s. Those are shown. Now, 120.5 can also be degrees, but that’s another subject.
Spot Gold Price Decline Since 2011 High
When doing PATTERN work one of the most common is the AB=CD or zigzag or just, simply, the basic measured move projection. The top left has the math doing “basic” PATTERN work.
- From 1913-1980 we had a $829/oz rise in spot Gold prices. That represents AB.
- From 1980-1999 we had the bear market in Gold which took it down to $252/oz.
- Note – that was a 19 year bear market.
- From the 1999 low we can now project AB and derive 1089.
- In PATTERN work, IF we have a failed pattern – in this case we do – price will invariably come back down or vice versa to that level again.
- Hence, 1089 is a target zone if/when Gold starts back down.
- Also, note that 2.0* AB = CD and that was right at 1916 (roughly 4 points or .0002 % from the all time high)
Additionally, we will always work a retracement grid and in this case our retracements in the “target zone” are as follows:
- .447 retracement from the 1913 low
- 5
- Square root of 5 = 2.236
- 1/2.236 = .447
- Square root of 5 = 2.236
- 5
- .5 retracement from the 1999 low
One last piece of work is the 1/8th increment projection technique from the Signal Reversal Candle. In this case, I moved down to the weekly chart because if I used the monthly chart PRICE for this projection ends all the way down -$450/oz. So, what you see is the “weekly” Signal Reversal Candle. (SRC is the candles that, in this case, close below the low of the candle that made the all-time high) Note, it’s hard to see, but that 1/8th SRC projection comes down to …. 1080.
So we’ll look at that week of Christmas 2014 for a low in Gold from a cycles perspective. And perhaps it will be right around $1080.
Guess what? If it’s not… then back to the drawing board. Ho Ho Ho …rock on, ok?
Follow Bart on Twitter: @BartsCharts
No position in any of the mentioned securities at the time of publication. Any opinions expressed herein are solely those of the author, and do not in any way represent the views or opinions of any other person or entity.
: Creating Bullish Divergence?")


 and Semiconductors (SMH): Concerning Price Pattern?")


