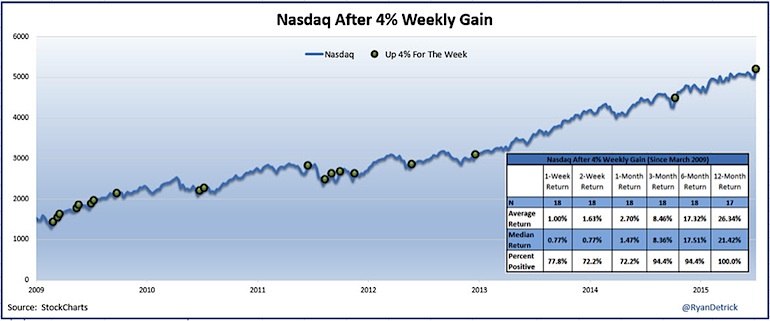
I continue to be amazed at how quickly the masses panic. Just two weeks ago all the rage was Greece is imploding, the Chinese stock market is collapsing, and the S&P 500 broke the 200-day moving average. This would all lead to the first 10% correction in the S&P 500 in nearly three years. A funny thing happened next, we saw a face ripper of a rally last week. In fact, the Nasdaq bounced four percent for the best gain in nearly nine months.
First things first, I took a look at other Nasdaq four percent weekly gains and the results in the near-term are rather strong. Of course, some of those happened near bottoms, not at a new all-time high like last week. Still, a big up week by itself isn’t something to get overly worried about.
Investor Sentiment
Now let’s talk about sentiment some. On just a 3% correction in the S&P 500, there was pure panic in the air. I’ve long been in the camp that as long as the Fed is accommodative and people continue to scare themselves all the way up, this bull market is alive and well. I still feel this way.
One of many ways to measure investor sentiment is by looking at sentiment polls. Are they precise? No. But, it pays to look at several investor sentiment polls to get a feel for what the majority are thinking. If everyone is scared, that could be what it takes to form a major low and let the bull market continue.
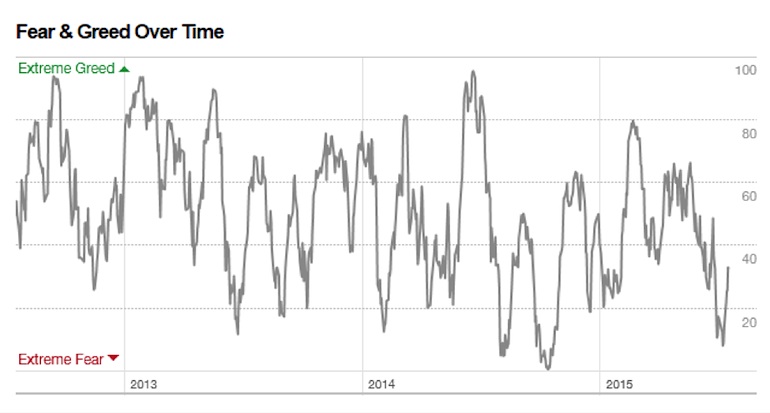
First up, the CNNMoney Fear & Greed Index was near its lowest level since the October/Ebola lows. Have to love seeing that.
The American Association of Individual Investors Sentiment Survey has seen bulls drop off the map. In fact, the 8-week moving average of bulls was recently near the lows of 2003 and 2009. Those were the best two times to buy equities going back 20 years by the way.
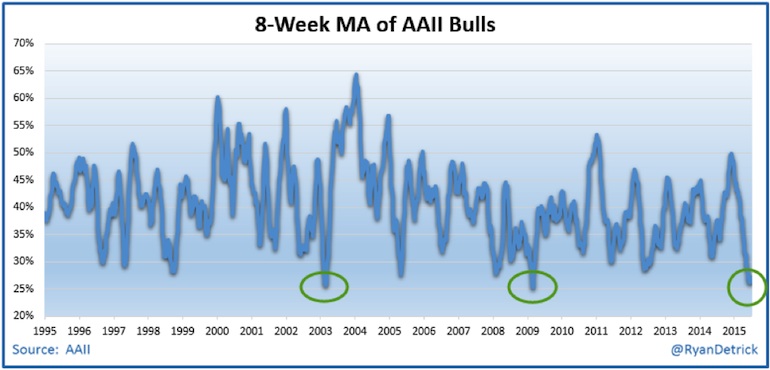
I get it. Many of you have pointed out flaws with the way the AAII does this survey. From the sample size is small, to only their own members can vote – I know, there are issues. Still, I don’t think we should totally ignore it either.
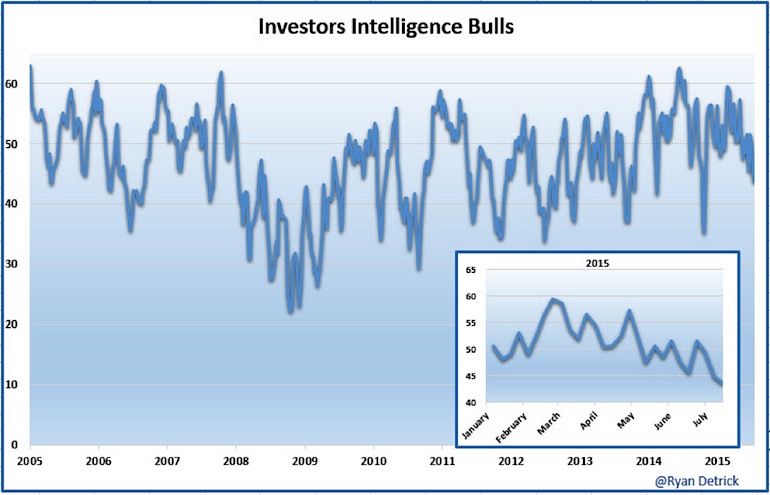
Lastly, I want to take a closer look at the Investors Intelligence US Advisors’ Sentiment Report. This one looks at what more than 100 newsletter advisors think about things. Wouldn’t you know it, in the midst of the Greece/China meltdown fears, the bulls hit a new calendar year low last week.
As a result, those now looking for a stock market correction spiked to more than 40%. This is significant and very rare. Ask yourself, if everyone is looking for a correction will it happen? It sure can, but market history says it is much better to fade the masses to consistently make a profit.
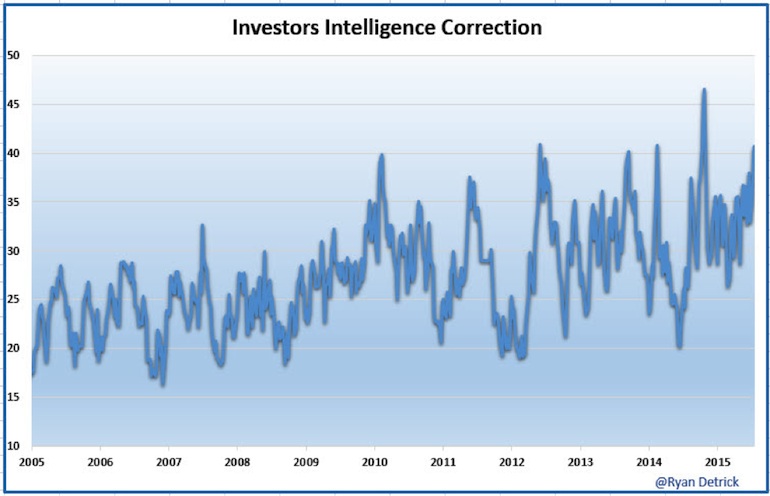
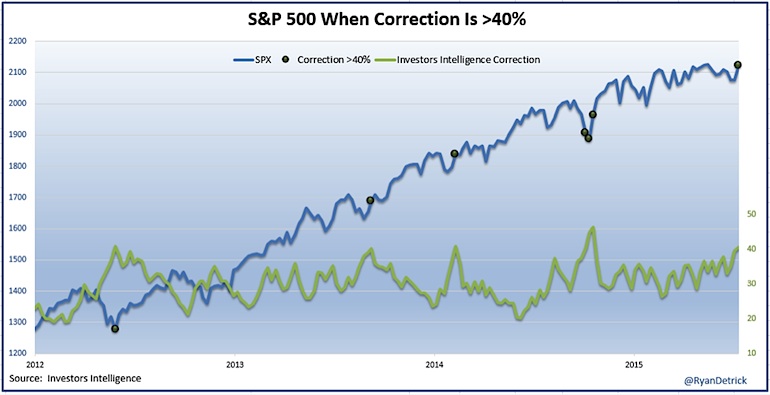
In fact, we didn’t see investor sentiment calls for a correction go greater than 40% from 1983 till mid-2012. Here’s a nice chart showing what things have looked like since 2012.
Here are the returns after those previous six spikes over 40%.
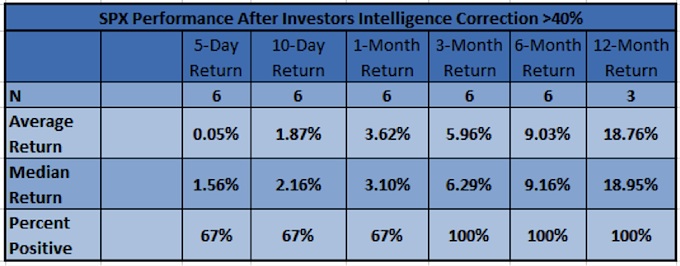
Let’s be honest, I could pick pretty much any random day since mid-2012 and the returns would be bullish. Still, this combined with the other investor sentiment measures I already mentioned suggest higher prices may be on the way.
Thanks for reading and have a great week.
Twitter: @RyanDetrick
Any opinions expressed herein are solely those of the author, and do not in any way represent the views or opinions of any other person or entity.


