Intel Corporation (INTC) reports earnings Wednesday night. According to Estimize, analysts are expecting Intel earnings to come in at an EPS of .59 on 13.09B in revenue.
According to Barron’s, S&P Capital IQ reiterated its “Buy” rating but said “we think INTC may temper full year expectations”. Intel’s stock has been trading heavy of late, touching new 52 week lows (28.82) last week. Will Intel earnings reverse the trend or shake the tree?
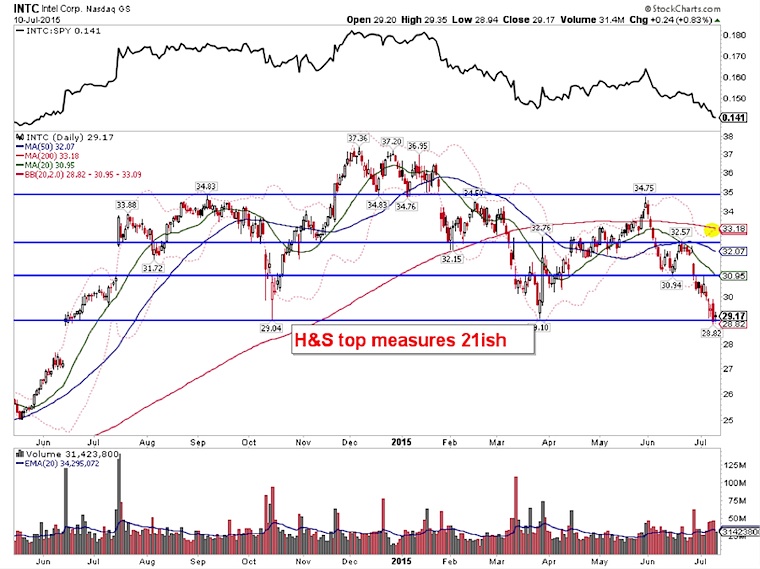
On the daily chart it’s clear there is a year long head and shoulders topping pattern. It’s also worth noting that trading volumes have picked up substantially as shares have moved lower from the late May peak. So the 28/29 area will be important into the Intel earnings report.
Other key price levels to note: 35.00, 32.50, 31.00 and of course 29.00.
Intel (INTC) Daily Stock Chart
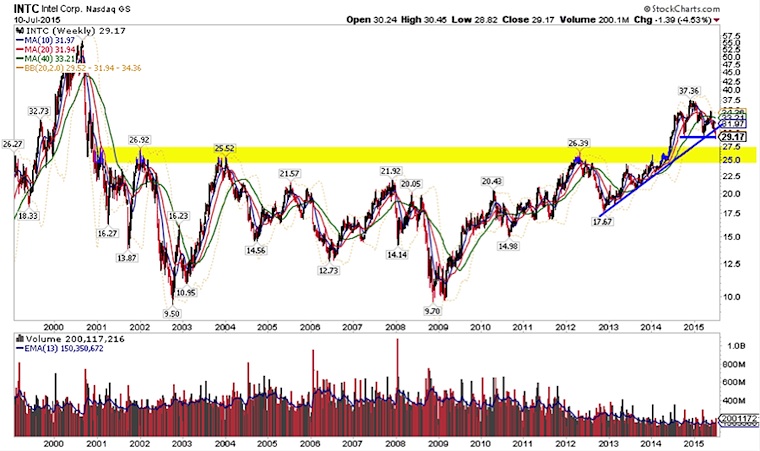
Looking at a much longer-term timeframe we can see that the 24-27 area is a major support zone. This would be the first major area to watch in the event of a negative reaction. If the head and shoulders breakdown does plays out, it measures down to 21. That would be a painful fall considering the 11 year bullish base that the stock price put in.
It’s also worth noting that the trend line from the late 2012 lows has recently been broken. Shares appear vulnerable here.
Intel (INTC) Weekly Stock Chart
Thanks for reading and have a good week.
Twitter: @ATMcharts
No position in any of the mentioned securities at the time of publication. Any opinions expressed herein are solely those of the author, and do not in any way represent the views or opinions of any other person or entity.


