Some investors put capital at risk with the hope of outperforming the cost of living (i.e. Inflation). One of the more popular investments in an attempt to beat the cost of life is ownership of a major stock market index like the S&P 500.
The chart below is of the S&P 500 and dates back nearly 150 years. The kicker here is that the chart is inflation adjusted.
The first whimsical thing that came to mind was the movie “Back to the Future”. But there’s something much more important to take note of: the S&P is now back at the levels it hit back in 2000, setting up the potential for an inflation adjusted stock market “Double Top” chart pattern.
The chart is also telling us that the stock market has not been doing a great job of beating inflation in the 21st century.
Inflation Adjusted S&P 500 Chart: 1871-2015
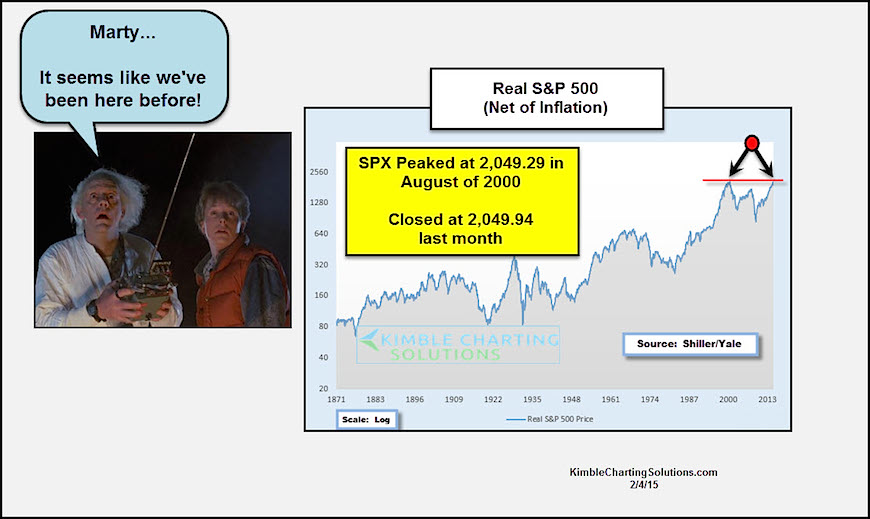
For those using the S&P 500 to beat the cost of living, let’s hope that this doesn’t turn into an inflation adjusted “Double Top” years down the road. Alternatively, what investors would like to see is a break out to new highs over the coming months. Thanks for reading.
Follow Chris on Twitter: @KimbleCharting
No positions in any mentioned securities at the time of publication. Any opinions expressed herein are solely those of the author, and do not in any way represent the views or opinions of any other person or entity.

: Showing Some Signs of Emerging Strength")
