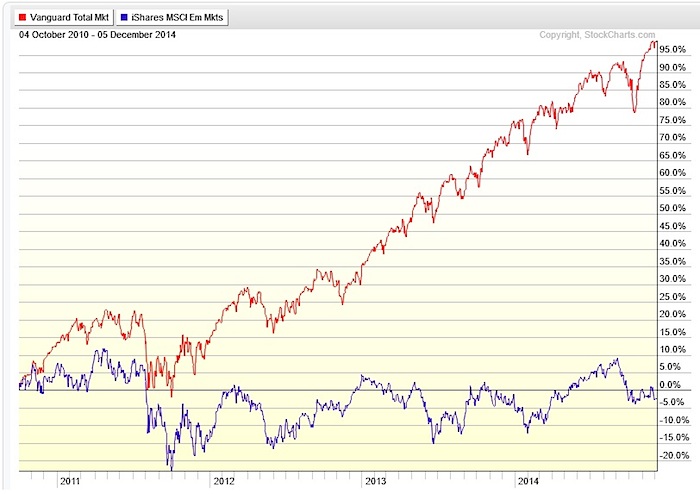
The weakness in Emerging Markets (EEM – Quote) has been well documented on several timeframes – since early September 2014, back to the beginning of 2013, even going back to the fall of 2010. The US stock market, as measured by the Vanguard Total Return (VTI), has returned 99% while EEM has returned negative 2.6% since October 4, 2010. As a technician, this relative weakness is certainly a red flag. While emerging markets have not worked over the past 4 years or so, there is a potential breakout setting up in one emerging market country: The India ETF (INDA)
Before we get into the India ETF, let’s take a look at EEM’s relative underperformance.
VTI vs EEM Chart – 4 Years
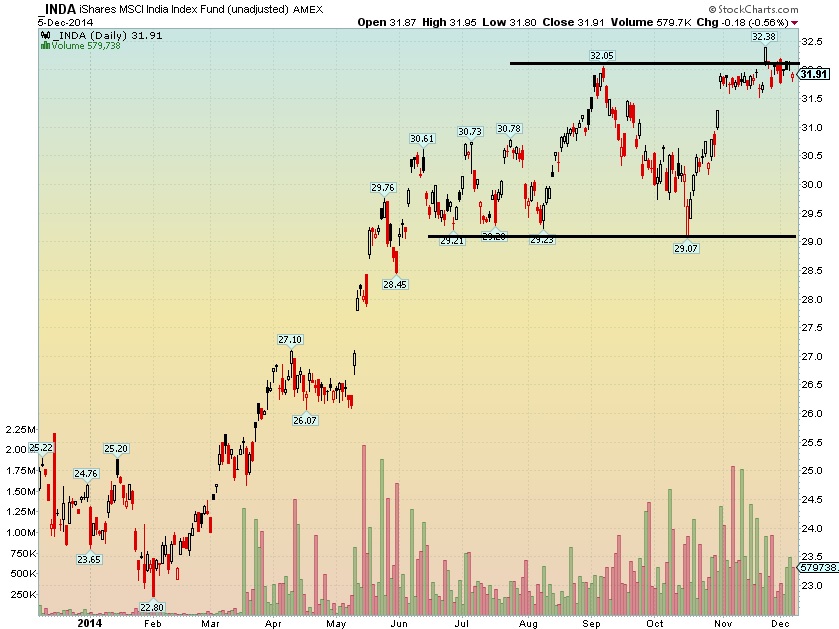
The iShares MSCI India Index Fund (INDA) shows a very nice consolidation right at the prior all-time high near $32. The October correction brought INDA back to the key $29 level which has shown impressive support since the early summer. We can take a measured move target on this $29 to $32 range to get a price objective of $35 for the India ETF.
Note as well that INDA had a small head-fake in mid-November about $32, however it did not lead to a big downside move.
iShares India Index Fund (INDA) – 1 Year Chart
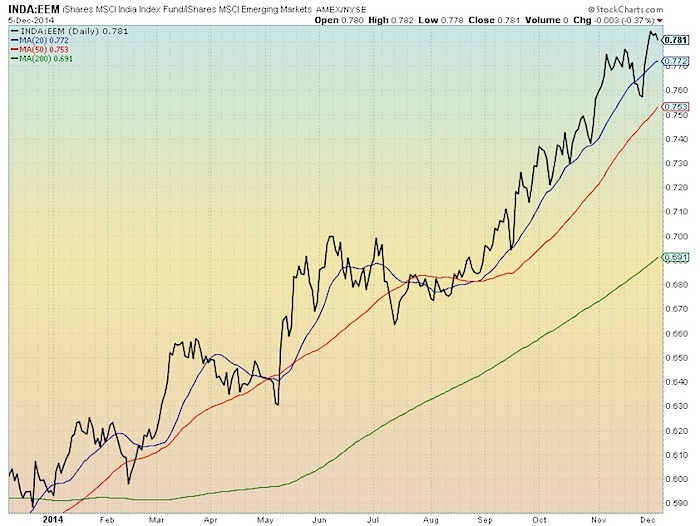
Lastly, you can see below how the ratio of INDA to EEM has been trending higher in 2014. To date in 2014, INDA has returned 29.3% versus EEM negative 1.4%.
INDA:EEM Ratio Chart – 1 Year
Thanks for reading.
Follow Mike on Twitter: @MikeZaccardi
No position in any of the mentioned securities at the time of publication. Any opinions expressed herein are solely those of the author, and do not in any way represent the views or opinions of any other person or entity.


