 As a technical analyst I rely on price to lead my bias. To help find interesting setups in price I use various indicators and second derivative data sets to accompany price action. These types of indicators, whether they be measures of breadth, momentum, or trend strength, all require price confirmation.
One way we can see if price is confirming a bearish or bullish signal in an indicator like momentum, specifically the Relative Strength Index (RSI), is to use trend lines. Below are three examples of broken trend lines that have taken place since the start of the year in the commodity market.
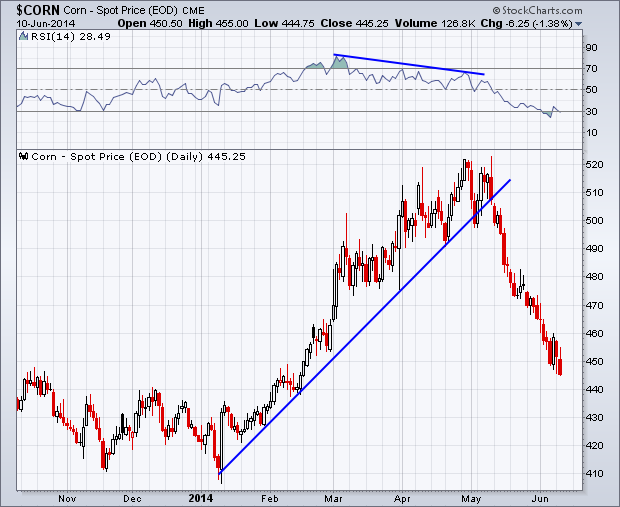
On May 5th in my Weekly Technical Market Outlook I wrote about the negative momentum divergence that was taking place in Corn (ZC_F). Corn prices, along with the bulk of agriculture commodities, had experienced a great run in the first couple of months of 2014. However, while momentum was diverging, price was also breaking key rising trend lines.
Here’s an updated chart of the price action in Corn along with the trend line and momentum divergence shown with blue lines. Corn prices have now fallen over 11% from that original trend line break.
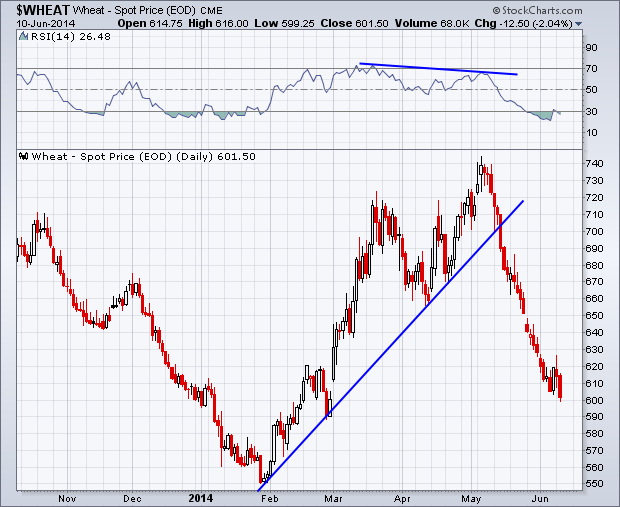
Next we have an example in the price action of Wheat. We saw a similar setup here, where Wheat prices broke above their March high while the Relative Strength Index made a lower high. This lead to a break of the trend line for Wheat and a 15% drop over the last month.
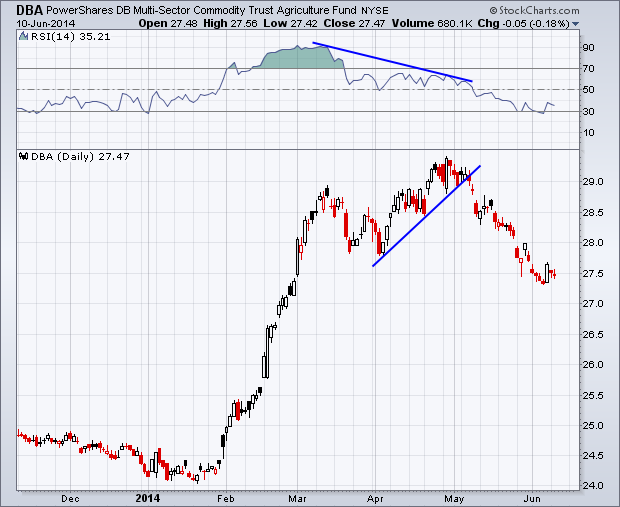
When we see these types of divergences and breaks in trend for specific assets we can see a potential red flag for the overall asset class, in this case commodities, specifically Powershares DB Agriculture Trust (DBA). In my April 21st Weekly Technical Market Outlook, I noted that price was approaching its prior high but negative divergences had developed in momentum and volume. While the trend lines for Corn and Wheat spanned the entire up trend in price, the trend line for DBA covered just the last third of the move. However, the eventual break in the trend line has sent DBA lower by 6%.
I hope the above examples help show that finding divergences, whether they are positive or negative, in underlying indicators are helpful in spotting potential turning points in a market. But waiting for price to confirm can be a critical step in anticipating a change in trend.
This post originally appeared on Andrew Thrasher’s blog. Twitter: @AndrewThrasher
No position in any of the mentioned securities at the time of publication. Any opinions expressed herein are solely those of the author, and do not in any way represent the views or opinions of any other person or entity.


")

