 It’s been a tough couple of years for International Business Machines (IBM) investors, as the stock has struggled to find a bottom. And it’s underperformance has been pretty glaring underperformed, especially when pitted against the red-hot U.S. equities market. So what’s next for IBM’s stock?
Well let’s walk through a couple of charts. Perhaps the pain for IBM’s investors is nearing an end.
Take a look at chart below – it’s a ratio analysis showing the relative strength of IBM stock versus the S&P 500 (SPX – Quote). As you can see it has underperformed the S&P since 2011. And it’s been nearly straight down for two years.
However, note that IBM just completed a .618 Fibonacci retracement (exactly) of the low on the ratio from 1993. It’s also showing a “bullish hammer” candlestick so, perhaps, we have institutional rotation occurring?
IBM Stock Relative Strength Chart – IBM:SPY since 1993

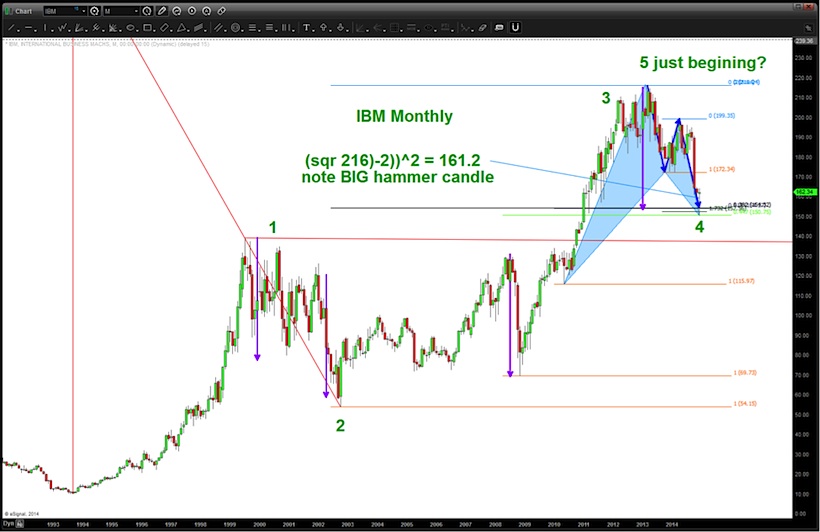
Now let’s now take a look at the price and time components of the IBM stock.
- Note, in the current area we have the following ratio’s all converging:
- AB=CD, .382, .447, 1.732 and the square root target.
- Also note the TIME component of the blue arrows. The TIME of the AB=CD PATTERN is hitting perfectly.
- We have NOT violated any rules in this count.
- 2 cannot retrace 1
- 3 is not the shortest
- 4 cannot go below 1
- VERY BULLISH Hammer Candlestick Pattern (MONTHLY) present.
- Note the presence of the purple measured move corrections. In the history of this chart, this correction has been present every time.
- If this analysis is correct, then we have the potential for a new “all time high” and the turn is just beginning.
Put this one on your radar screen for 2015 and watch for a weekly volume and momentum increase. The combination of a major 20 year .618 retracement of the relative strength combined with the completion of a bullish pattern may be signaling a bottom for IBM stock and the end of the 2 year bear market.
IBM Elliott Wave CHART – Is a Wave 5 higher about To begin?
Thanks for reading!
Follow Bart on Twitter: @BartsCharts
No position in any of the mentioned securities at the time of publication. Any opinions expressed herein are solely those of the author, and do not in any way represent the views or opinions of any other person or entity. IBM photo from A. Penkov/123RF.


 Ready To Break Out?")
