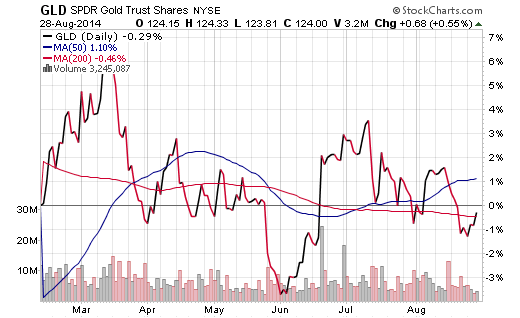
The headline number on the SPDR Gold Shares ETF (GLD) is that it has gained 6.79% so far in 2014. However, the reality is that gold bullion hasn’t gained a dime in over six months.
Since February 12, GLD has been mired in a roller coaster sideways trading range that has yet to resolve in a bullish or bearish trend.
In fact, if you look closely at the chart over the last six months you can see that the 50 and 200-day moving averages are starting to flatten out and come together. This is indicative of an investment that can’t seem to make up its mind whether to run higher or lower. It seems that nearly every rally is met with sellers and each decline seems to be bought along the way as well.
GLD Daily Stock Chart
Over that same six-month time period, the SPDR S&P 500 ETF (SPY) has gained 10.99%, while the iShares 20+ Treasury Bond ETF (TLT) has gained 13.45%. Clearly the proliferation of the falling interest rate environment has continued to buoy stocks and bonds, while forsaking precious metals.
I have been avoiding gold for some time now because of this trend-less malaise that it has settled into. There doesn’t seem to be a convincing edge in either direction until we see a break out of the recent consolidation. GLD has been frustrating for both long-term investors and short-term traders alike because it has decoupled from any rational notion of a safety or inflation bet that has historically been a hallmark of this widely-owned asset class.
Year-to-date fund flows aren’t really giving us any indications either. So far this year GLD has gained exactly $14.59 million in new assets, according to ETF.com. That is fractional for a $32.8 billion ETF that trades average volume of over 6 million shares per day. Weekly fund flow data shows a tug of war between buyers and sellers that looks as directionless as the price chart.
Other precious metals such as the iShares Silver Trust (SLV) are actually in worse shape and are barely clinging to the flat line so far this year. SLV has experienced even more volatility than GLD amid sellers pilling into the futures markets.
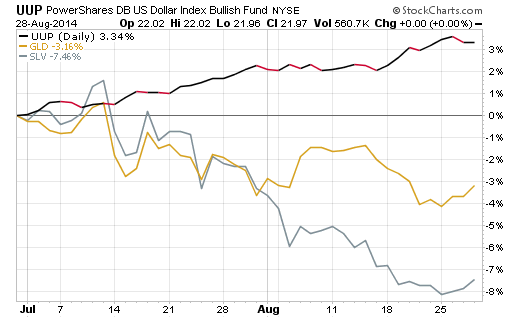
In addition, both precious metals are likely experiencing some headwinds in the form of U.S. Dollar strength – see the PowerShares US Dollar Bullish ETF (UUP) charted below. On a short-term basis, both Gold (GLD) and Silver (SLV) began to reverse course and move lower when the dollar began its most recent ascent at the beginning of July.
UUP vs GLD vs SLV Performance Chart
Ultimately the winds of change will sweep through the precious metals sector and light them on fire once again. However, in my opinion, the current environment doesn’t support a reason for owning this asset class yet. Instead, I am focusing on definable trends in equities and fixed-income.
When the time comes to reallocate back to Gold and/or the precious metals sector, these ETFs will be on my watch list. Until then, I’ll simply continue to follow market trends. Thanks for reading.
No position in any of the mentioned securities at the time of publication. Any opinions expressed herein are solely those of the author, and do not in any way represent the views or opinions of any other person or entity.


 Ready To Break Out?")


