 By Brad Tompkins
Last week the commerce department released their estimate of 2012 third quarter’s GDP growth rate. The preliminary 2.0% growth was better than 1.3% the previous quarter (revised down from 1.7%), but not much to celebrate. We’ve also now heard a little over half of the earnings announcements for the quarter. Ongoing projected GAAP earnings for the S&P500 is still on track for $90 per share for the year (63% of companies beat estimates while just under 23% have missed). I’d like to put the relationship between these numbers into perspective and discuss why retail equity market investors should pay attention to macroeconomic reporting.
Background: What is GDP?
Gross Domestic Product is a sum of Personal Consumption, Business Investment, Government Spending & Net Exports for the country. GDP is by no means a perfect measure of prosperity but does give investors a fairly consistent accounting which can be correlated to equity market performance over a very long time period. Those correlations are weak in the short term, but strong enough over long stretches to give an investor a performance edge. And if we can do a little better over time by incorporating GDP into our overall strategy, then it is worth the effort.
Linkage between GDP, Earnings & Equity Performance
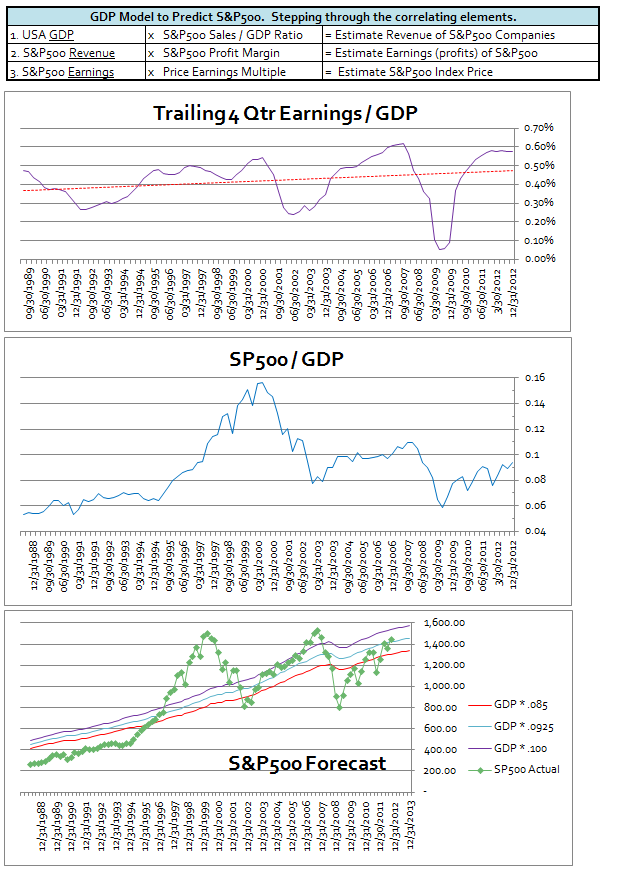
Common sense tells us that our stock portfolio will do better during periods of increasing prosperity in the country. When formally modeling the linkage between GDP, Corporate Earnings & Equity Prices it is necessary to take a fairly complex path with many variables and assumptions. Here is an abbreviated back-of-the-napkin calculation along with the related visuals:
Forecasting a Range for S&P500 Index from GDP Ratios
We can combine the first two calculation steps to come up with a historical picture of the SP500 aggregate earnings to GDP ratio. The Earnings / GDP ratio has been fairly regular in its swings above and below the regression midline in conjunction with the expansionary/recessionary business cycle. Taking another step to incorporate the PE ratio in with our earnings calculation, we can create a composite of all three factors and arrive at a ratio of S&P500 Index to GDP. Lastly, we can use that information in a chart with a range of forecasts against the actual S&P500 to get some perspective over the last 20+ years and get an idea where next year’s S&P500 index could end up if our assumptions hold.
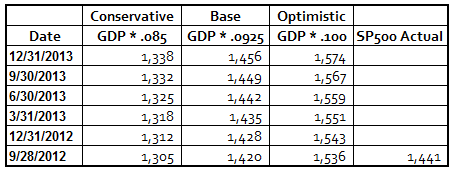
Assumptions Note: Used 2Q2012 GDP Growth Rate of 1.3% then 2% for remainder of 2012 and into 2013. Conservative Band Estimate .085 is 12 quarter SP500/GDP ratio average. Midline Estimate .0925 is roughly the average of the last 3 quarters. Optimistic Estimate .100 is $90 per share as reported GAAP SP500 earnings / $15.3 trillion GDP x 17 PE ratio. Pessimistic Band Estimate .070 (not charted: SP500 estimation line from 450 in 1993 to 1100 in 2013) is the peak to peak average GDP ratio from 1966 to 2000. Here are forecasted numbers for the three scenarios shown:
Macro Numbers & Downside Risks
So the point of the exercise is partly to attempt to forecast the S&P500 next year but as importantly to get you to think about macro economic reports and how that information might adversely feed back into equity prices. Obviously if GDP growth forecasts continue to be revised lower then there is going to be downward pressure on equity prices. Onset of a full recession where GDP declines is likely to deliver a triple whammy to the forecast – Profit margins and PE ratios could significantly drop simultaneously with GDP.
Also consider the more timely GDP sub-component reports. If unemployment gets worse and personal income is weakened then personal consumption which makes up about 70% of GDP is going down. If durable goods orders which represent business investment have another down month, then that pressures GDP downward. If our government can’t address the fiscal cliff issues then government spending is going to drop and GDP is negatively affected.
We also should pay attention to the other two factors in our calculation — profitability and sentiment reports. S&P500 profit ratios are mean reverting and happen to be stretched nearly to 2007 levels and are higher than all other years going back to the 1960’s. Reduced profitability could come from many directions – interest rate hikes increase borrowing costs, wage & commodity inflation, European debt write downs, etc… Finally, watch for reports that hint toward more bearish sentiment (less willingness by investors to pay a premium for future earnings) and drive down the PE ratio figure in our assumptions.
Where is Our Edge?
So how does any of this give us an investing edge? Admittedly, in the very short term it doesn’t. After all, the market doesn’t obey silly economic models. Rather, it inexplicably finds a way to make any published forecasts like this look as foolish as possible. But over the long term, we can recognize when the stock market is severely overvalued or undervalued compared to historical calculations and adjust our equity allocations accordingly. We want heavier equity exposure when GDP, profitability, and sentiment measures look to be at historical low points and swinging higher (1982, 2002 & 2009). Likewise, if the same items are stretched and turning downward (1999 & 2007) we are better served with a defensive portfolio and smaller equity positions.
GDP and S&P500 Trends are Up and to the Right
My final comment is that in spite of the overall bearish tone and the risk warnings which have me leaning away from the optimistic scenario, reality is that GDP and the stock market have persevered on their run up and to the right as chartists will say. This continued trend higher may be largely due to aggressive fiscal deficit spending and central bank interventions (I have a hunch that they have GDP targets that drive policy as much as the publicly stated inflation and unemployment targets). Regardless, until quarterly GDP reports and aggregate earnings actually fade off the uptrend, watch for opportunities to reallocate equity funds that have been parked on the sidelines during this recent correction.
—————————————
Twitter: @BBTompkins and @seeitmarket Facebook: See It Market
No position in any of the securities mentioned at the time of publication.
Any opinions expressed herein are solely those of the author, and do not in any way represent the views or opinions of any other person or entity.


