 As European stocks began to crack in early July, U.S. equities continued to climb higher. Although this divergence seemed minor at first, it would turn out to be a near-term warning for global investors. Indices like the S&P 500 would eventually follow European stocks lower. And when coupled with the recent stealth drop in the Euro, it’s apparent that concerns around the Russian-Ukraine conflict (and correlated markets) need to be on our collective trader radar.
Especially now. And the charts below will tell you why.
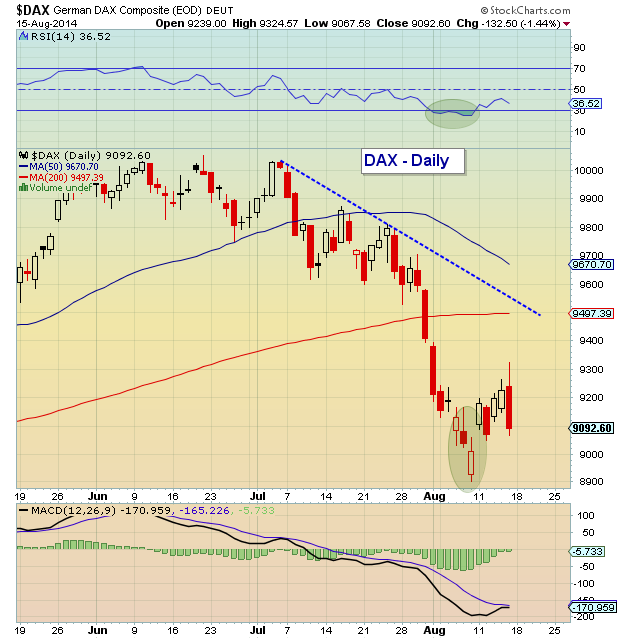
Sure, the S&P 500 only experienced half the pain the German DAX did, but both indices bounced at nearly the same time off key technical support levels. For the S&P 500, it was 1900; and for the DAX, it was 8900/9000. These levels will need to hold if global equities are going to make another run higher.
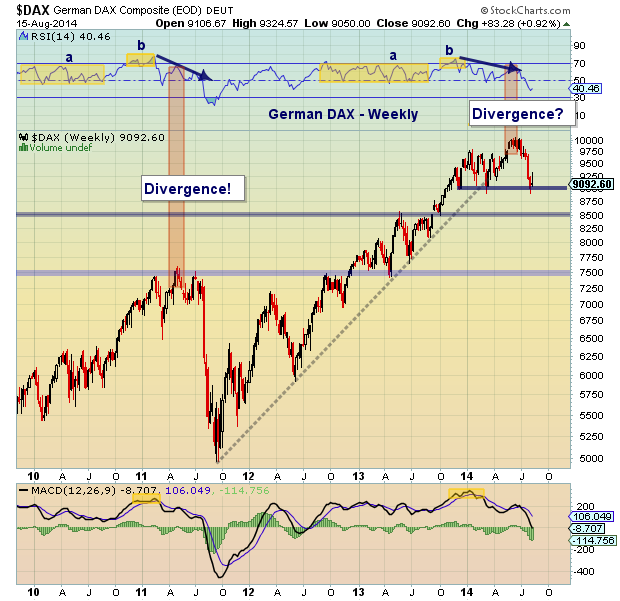
But upside could be limited over the near-term for the German DAX, as a nasty divergence will need to be worked off on the weekly chart. That said, there is still a distinct possibility that the index could rally a bit more (and this could push the S&P 500 higher). Again, watch the recent lows.
German DAX Weekly Chart
German DAX Daily Chart
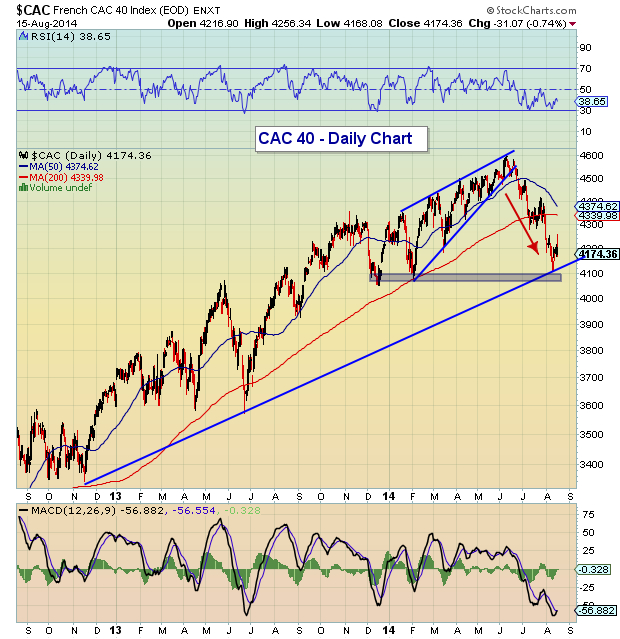
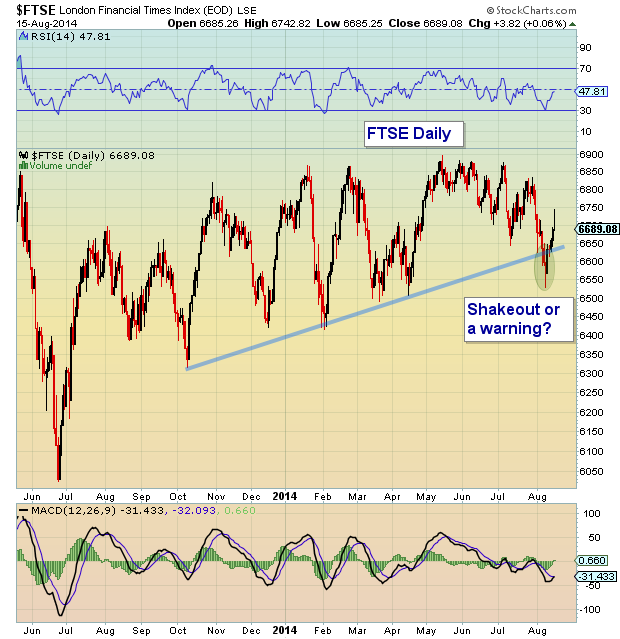
Other European indices bounced in unison as well. Below is a look at London’s FTSE and the French CAC 40. Again, not much margin for error for European stocks near-term, especially with the CAC 40. But both indices touched down near 30 RSI andsupport is support until it is materially broken.
CAC 40 Daily Chart
London FTSE Daily Chart
Finally, I want to take a look at a couple of charts that highlight the recent tensions with Russia (and explain why European stocks have been battered of late).
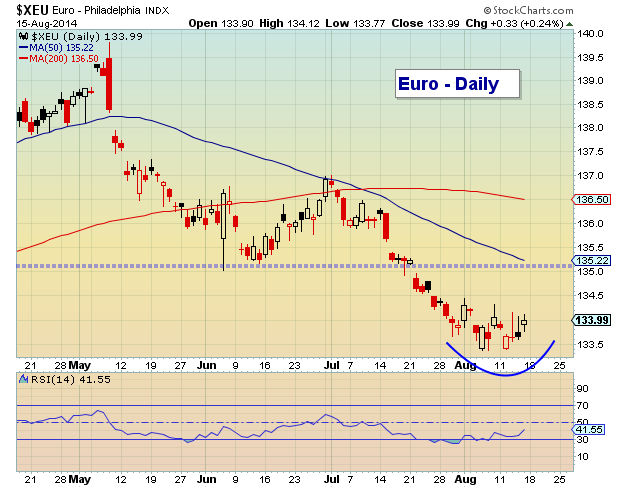
The first is the Euro. The fact that it hasn’t bounced much is reason to for concern. However, it seems to be trying to form a base here and has room up to around 134.75/135.00 before any substantial resistance. That said, it is still in a downtrend and any further deterioration could mean rising tensions and equate to another drop in European stocks.
The Euro Daily Chart
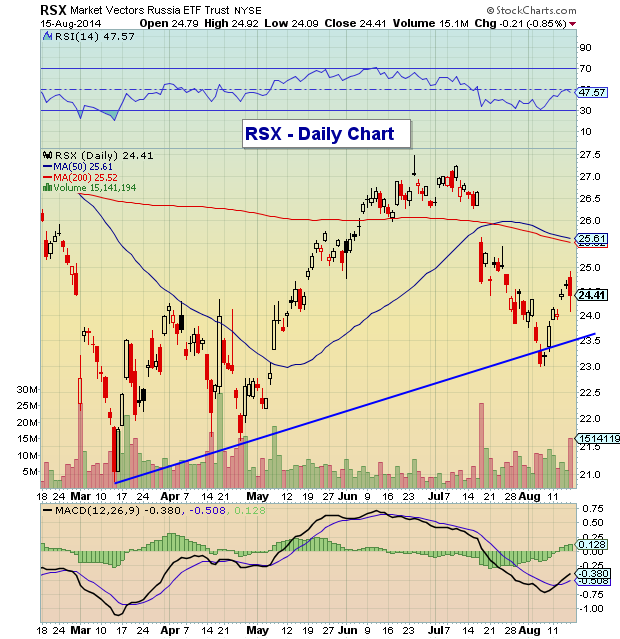
The last chart is the Russian ETF (RSX). It also bounced on cue and has formed a series of higher lows. This will be critical to watch.
The Russian ETF (RSX) Daily Chart
Trade safe. Thanks for reading.
No position in any of the mentioned securities at the time of publication. Any opinions expressed herein are solely those of the author, and do not in any way represent the views or opinions of any other person or entity.


")


