One notably weak sector ETF (outside of the Utilities) is the Energy Sector SPDR (XLE). Let’s take a look at the recent price action to see what’s going on and try to highlight what we should be watching going forward.
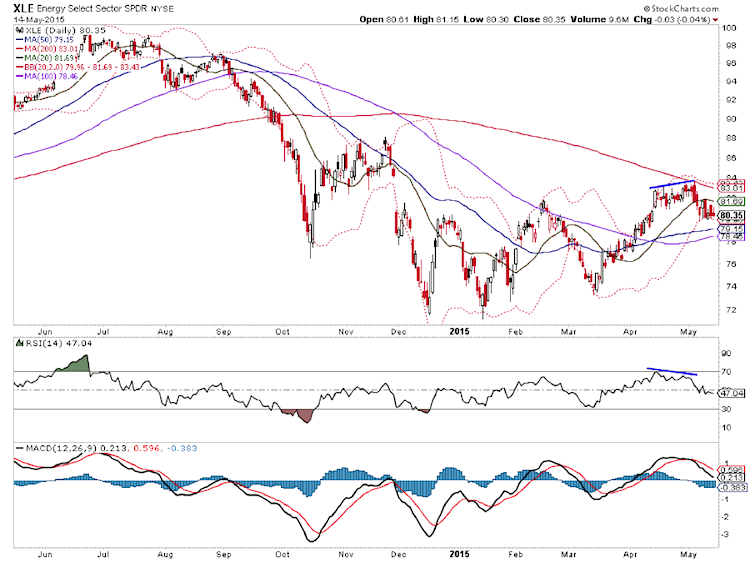
As you can see in the chart below, the Energy Sector (XLE) formed a negative RSI divergence on its most recent highs (late April/early May). This also occurred as it hit its 200 day moving average. After XLE tested its 200 day ma, it promptly took out 8 sessions worth of price action in the same trading day. That weakness then gave way to a quick drift to the lower bollinger band.
Energy Sector (XLE) Chart – Negative Divergence
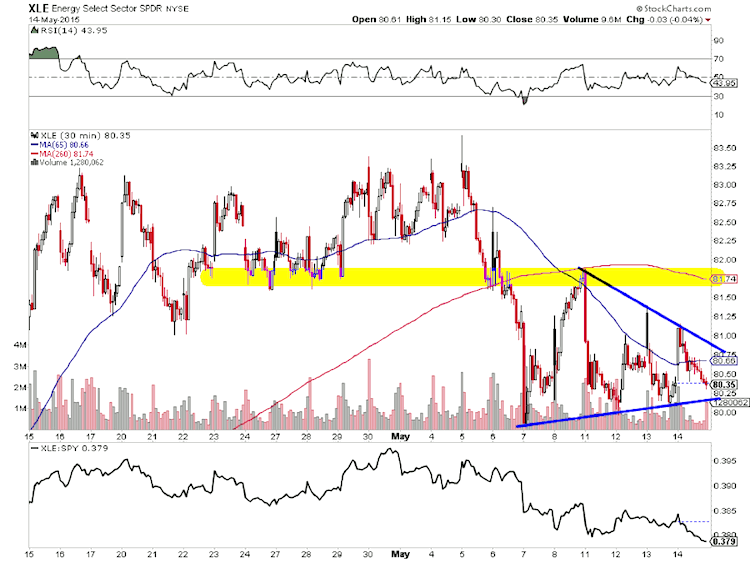
Moving to an shorter term chart, we see a new trendless range that’s developed within a two-point wedge. Note as well the key pivot area around 82 and the rising 50 day moving average (support) just below.
Energy Sector (XLE) Chart – Near-Term View
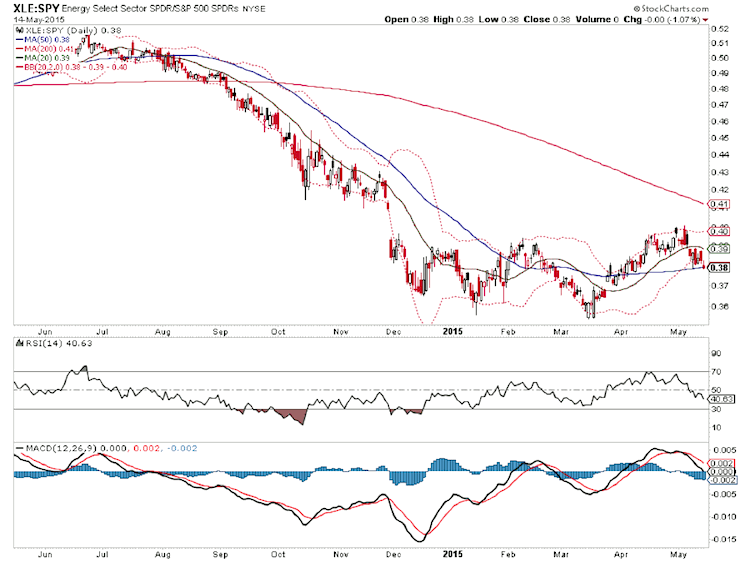
The XLE to S&P 500 ETF (SPY) ratio is testing it’s flat 50 day moving average.
XLE: SPY Relative Strength Chart
It’s worth noting the price and relative strength bollinger bands have expanded lower. Judging by the near-term action, I would expect a two point move in whatever direction the wedge breaks. With key support just below, let’s stay tuned to see if price and relative strength can rebound.
Follow Aaron on Twitter: @ATMcharts
Author has a trading position in related security DUG (which is an ultrashort Oil & Gas ETF) at the time of publication. Any opinions expressed herein are solely those of the author, and do not in any way represent the views or opinions of any other person or entity.


