The Emerging Markets, as measured by the iShares Emerging Markets ETF (EEM), are back to the bottom of an established range. Looking at the weekly chart below, you can see this well-defined range has persisted since the US debt ceiling crisis back in August 2011 – happy 4th birthday! Some will recall a false breakout nearly this time of year ago when the Emerging Markets ETF (EEM) had a weekly close above the 45 resistance point. Bulls would have been quite frustrated with that move. EEM is down more than 20% since that weekly close in September 2014.
Emerging Markets (EEM) Weekly Chart
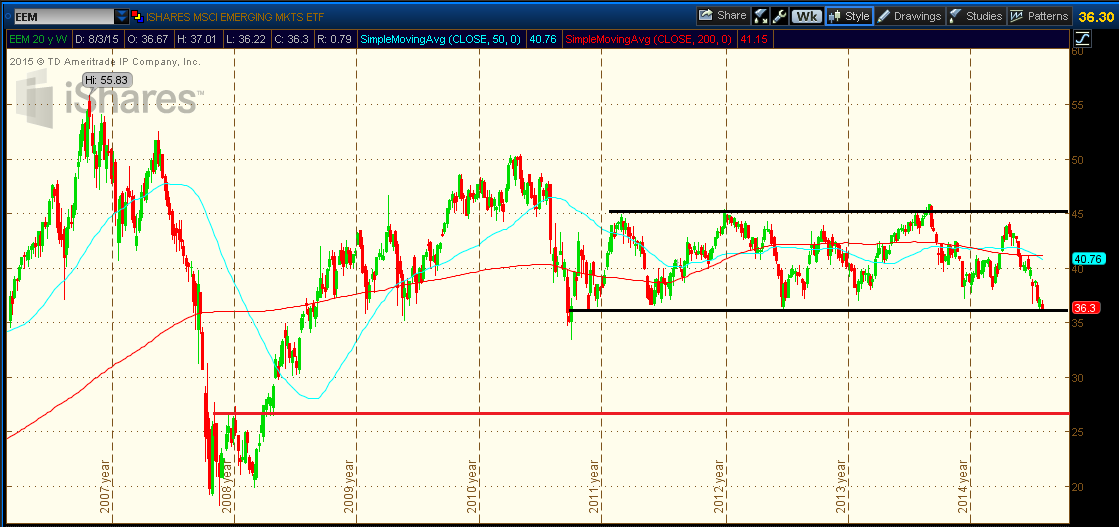
Should the $36 level break to the downside, a $27 bearish measured move target would be trigged. Simply take the prior range, we’ll call it $9, and subtract it from the breakdown level of $36. These are rough numbers, but it gives the trader an idea of the magnitude of the potential move that could take place following a breakdown from the multi-year trading range. Notice in the chart above that the bearish price objective has confluence with 2008-2009 bear market lows. That prior congestion zone should give EEM support.
That is the bearish case. The bullish case is that this is simply another ‘buy the dip’ scenario in EEM, as has been the case each time it has visited this mid-$30s area since 2011. A trader has done well buying the mid-30s and selling the mid-40s on the Emerging Markets ETF. Certainly a sell stop would be warranted below the range lows.
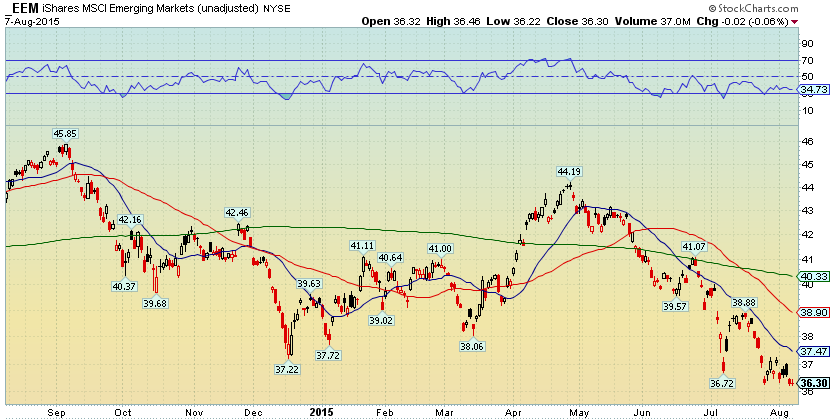
Looking a bit more near-term in the chart below, you can see the exceptionally bearish price action since the April high. The chart is actually similar to that of 2011 when EEM gained more than 5% in the first four months of the year, but then severely broke down in the late spring and summer. The spring peak in 2011 was May 2, the peak this year was April 28. EEM went on to collapse by 34% in about 5 months to the October 2011 low. From April 28, 2015 peak, EEM is currently down 18%.
Emerging Markets (EEM) Daily Chart
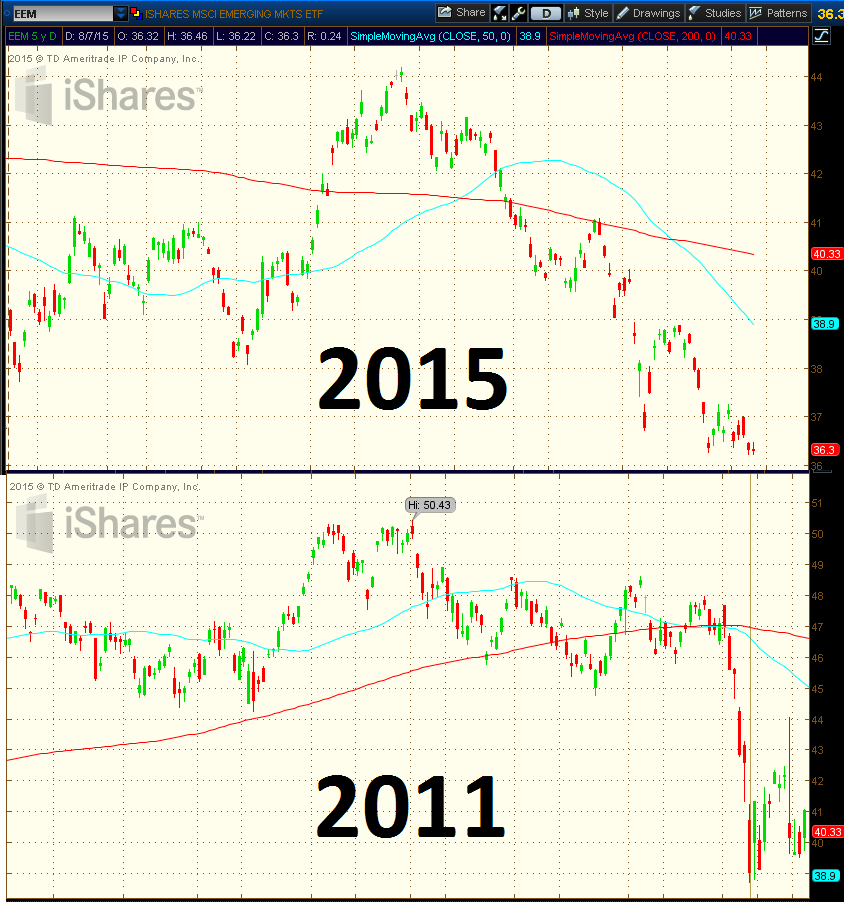
Notice in the 2015 vs 2011 comparison in EEM below, the death cross of the 50-day moving average below the 200-day moving average occurred at nearly the same date on the calendar. Also, the interim low on EEM was August 8, 2011 (precisely 4 years ago as of this writing). Time will tell if the Emerging Markets ETF continues to follow 2011’s path.
Emerging Market (EEM) Chart – 2011 vs 2015
Thanks for reading.
Twitter: @MikeZaccardi
No position in any of the mentioned securities at the time of publication. Any opinions expressed herein are solely those of the author, and do not in any way represent the views or opinions of any other person or entity.

: Creating Bullish Divergence?")

: Creating Bullish Divergence?")


