Though backed up against long-term trend line resistance, the Dow Jones Transportation Average (DJTA) continues to grind higher in 2014, moving from strength to strength in it’s largest nominal and real cyclical move higher since at least the mid-1980s.
As a result “The Transports” have entered a rarefied, “persistently overbought” state on its monthly chart. Since the Crash of 1987, DJTA has gone through 9 “persistently overbought” periods, defined here as “at least one month; but in most cases multiple months with a monthly RSI exceeding 70 in close proximity to one another”.
Some familiarity with market cycles over the last 30 years will allow you guess where they are: of the 9 periods studied, 4 were in the mid-to-late 1990s; and 3 in the mid-to-late 2000s. Another occurred in the late 1980s just before the S&L Crisis unfolded; and the last is occurring now, underway for 18 months running.
Dow Transports: Monthly – Persistently Overbought States, 1987-2001.
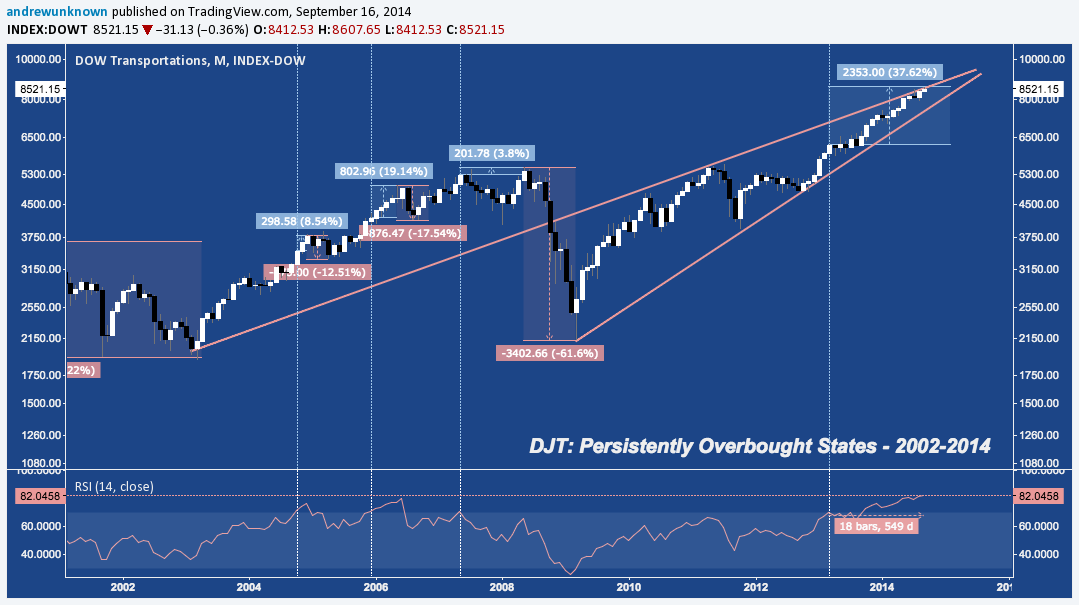
Dow Transports: Monthly – Persistently Overbought States, 2002-2014.
Major Corrections Follow
Each of the 8 historic periods were by followed by a correction; and in a couple cases bona fide Crashes with an average decline of -30.49% and (accounting for those outliers) a median decline: -22.76%.
Adverse Excursions: The Pops Before the Drops
Importantly, measuring in each case from when DJTA first registered an RSI >70 to the subsequent price high shows that in 7 of these 8 periods the index continued to advance – an “adverse excursion”- creating the persistently overbought state before ultimately turning down. Noted in blue above, The average advance in these excursions was +19.71%, and the median advance: +14.46%. The single instance without an interim advance (late 1995) saw an RSI >70 for only 1 month, suffering a -11.7% correction over the next 6 weeks.
How Does the Current Period Compare?
The current period is DJTA’s most persistently overbought state in the last 27 years under review. In duration, the “adverse excursion” has lasted 18 months (since March 2013), well-exceeding previous 14-month record (April 1997-June 1998). The range covered in the current period’s advance ranks 3rd of 8 at +37.62%, with 1997-1998’s +43.54% and 1989’s +45.09% ranking higher. As you’ll note from above, the current advance is almost twice the historical average, and nearly triple the median.
Over the 7 periods featuring adverse excursions a historic trend is apparent: the more protracted the persistently overbought state, the larger the nominal subsequent drop. In fact – excluding 2007-2008’s drop, which was some 1400% of the adverse excursion preceding it – the typical correction retraces 175% of the adverse excursion.
Extrapolating from the past to stake claims on future performance can be a dangerous business; but a decision to ignore or trivialize past outcomes that arose in like conditions is similarly risky, in its own way. Taking care to make our own calculated risks, here are some general projections based on DJTA’s past performance as derived from the sample space noted above.
How much further could DJTA’s adverse excursion extend?
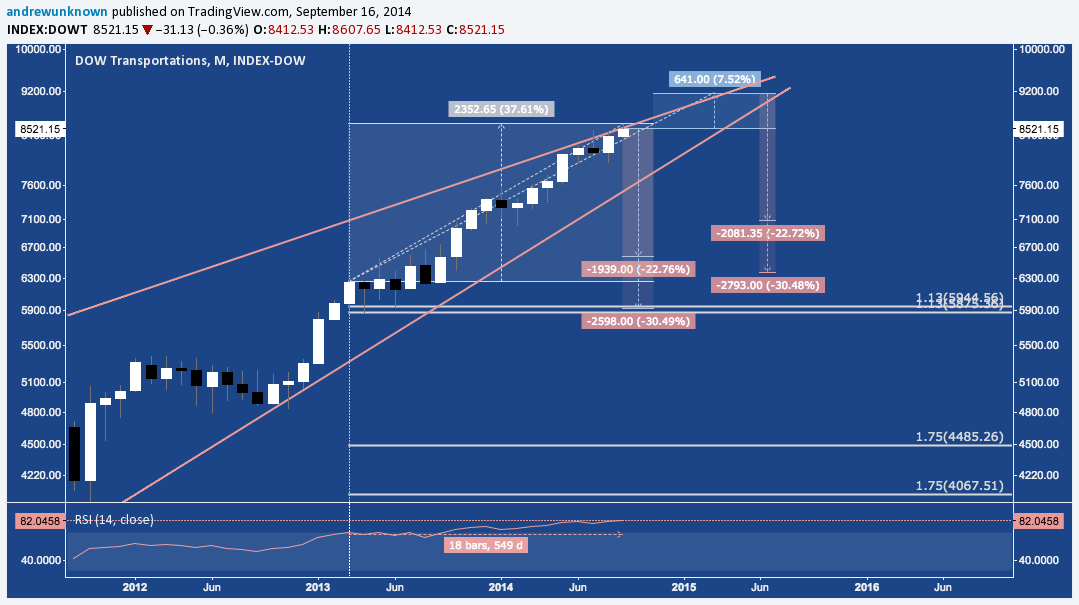
At +37.52% (measuring from the March 2013 close at 6255), 1989’s record of 45.04% is +7.52% from current levels. Based on a daily closing value of 8521 (09/15/2014), this comes out to 9162.
And – consistent with the past – what would the subsequent drop look like?
From the current close at 8521, the average correction of -30.49% takes DJTA to 5923, while the median goes to 6582. For the sake of argument, a close matching 1989’s record at 9162 sees an average decline down to 6369; and a median drop measures to 7077.
Additionally, let’s consider that the smallest retracement of the 6 historic occurrences with an adverse excursion to the 113.1% fibonacci extension occurred in 2006; and again, the average retracement of the adverse excursion on the subsequent correction is approximately 175% (excluding 2007-2008).
Here is a composite chart of how these projections look against the current market:
Dow Transports: Monthly – Projections From 2013-2014’s Persistently Overbought State
Trade ‘Em Well.
Twitter: @andrewunknown
Author holds no position in the securities mentioned at the time of publication. Commentary provided is for educational purposes only and in no way constitutes trading or investment advice. Chart courtesy of TradingView.com. Transport icon image via freepik.com


")


