 By Andrew Nyquist
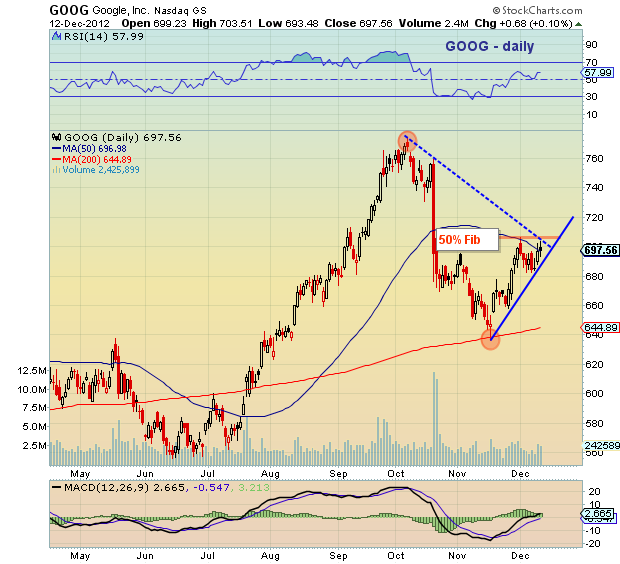
Last week, I felt compelled to comment on the short-term technical setup for Google (GOOG). No, I didn’t have a position, but I did see a short-term opportunity to highlight and educate about the importance of technical resistance. In short, the stock had run higher, but was moving into stiff resistance after reaching up and touching the 50 percent Fibonacci retracement and 50 Day Moving Average (DMA).
Since then, the stock has consolidated in a 2 to 3 percent range and currently resides on the 50 DMA, just below the downtrend line and 50 percent Fib and above the uptrend line. Short-term traders need to be on their toes.
I would suspect a brief increase in volatility, as well as a slightly higher chance of a false move (due to the tension on the tape). But either way, we should get short-term directional resolution over the coming days.
Trade safe, trade disciplined.
More charts found here.
Google (GOOG) stock chart as of December 12, 2012. GOOG stock analysis with support and resistance levels and fibonacci retracements.
———————————————————
Twitter: @andrewnyquist and @seeitmarket Facebook: See It Market
No position in any of the securities mentioned at the time of publication.
Any opinions expressed herein are solely those of the author, and do not in any way represent the views or opinions of his employer or any other person or entity.


