The following is a recap of the September 23 COT Report (Commitment Of Traders) released by the CFTC (Commodity Futures Trading Commission) looking at COT data and futures positions of non-commercial holdings as of September 20.
Note that the change in COT report data is week-over-week. Excerpts of this blog post originally appeared on Paban’s blog.
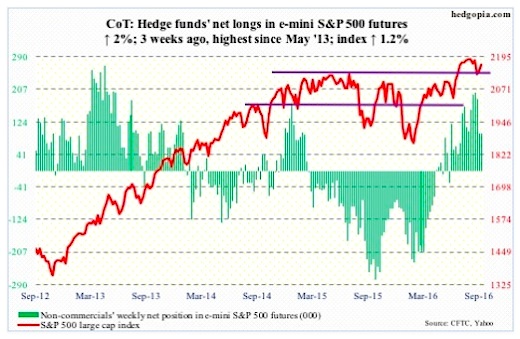
E-mini S&P 500 Futures: Companies will start reporting 3Q16 in a couple of weeks. As has been the case for at least the last six quarters, estimates have been under persistent pressure going into earnings. Since the quarter started, 3Q16 operating earnings estimates have been cut by $0.97 to $29.36 … and by $5.25 since the end of 1Q15. If the past is a guide, this helps the stock market. In five of the last six quarters, the S&P 500 Index (INDEXSP:.INX) was up in the first month of the quarter, when earnings are reported.
Stock market bulls would appreciate a little help from flows, though. In the week ended Wednesday the SPDR S&P 500 ETF (NYSEARCA:SPY), lost another $3.1 billion; last week, $3.4 billion was withdrawn (courtesy of ETF.com).
In the same week, U.S.-based equity funds lost $3.4 billion (courtesy of Lipper). Since the June 29th week this year, $40 billion has been redeemed, and $93 billion since the February 10th week this year. The S&P 500 had important bottoms around those dates.
The index rallied strongly off of make-or-break support at 2120, but were repelled at 2178 resistance. Bulls have the ball, and it is theirs to lose.
September 23 COT Report: Currently net long 95.5k, up 1.9k.
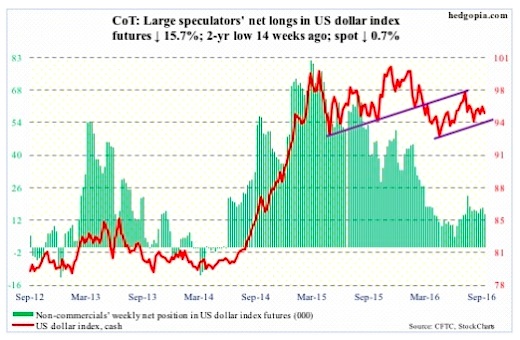
US Dollar Index: The spot had a wild ride on Wednesday, first rallying post-BoJ and then weakening post-FOMC, with the session high kissing the upper Bollinger Band and also past the 200-day moving average; in the end, the U.S. Dollar lost both 50- and 200-day.
The probable path of least resistance is down, with a test of the early-May 2016 rising trend line around 94.50. This is where the lower Bollinger band for the U.S. Dollar lies.
September 23 COT Report: Currently net long 14.4k, down 2.7k.
Crude oil: Saudi Arabia produced a record 10.673 million barrels per day in July, up from 10.550 mb/d in June. Its crude exports rose to 7.622 mb/d from 7.456 mb/d in June. Next week, OPEC meets in Algiers. Its 14 members are pumping more than 33 million barrels per day. Inaction means oil glut only gets worse.
In the U.S., in the week ended September 16th, crude stocks fell by 6.2 million barrels to 504.6 million barrels – the lowest since February 26th this year.
Gasoline stocks dropped by 3.2 million barrels to 225.2 million barrels. This was the lowest since December 25th last year.
Distillate stocks, however, rose by 2.2 million barrels to 165 million barrels – the highest since January 8th this year.
Crude oil production increased by 19,000 b/d to 8.51 mb/d – a four-week high. Production peaked at 9.61 mb/d in the June 5th week last year.
Crude oil imports stood at 8.3 mb/d, up 247,000 b/d.
Refinery utilization fell nine-tenths of a point to 92 percent – a 13-week low.
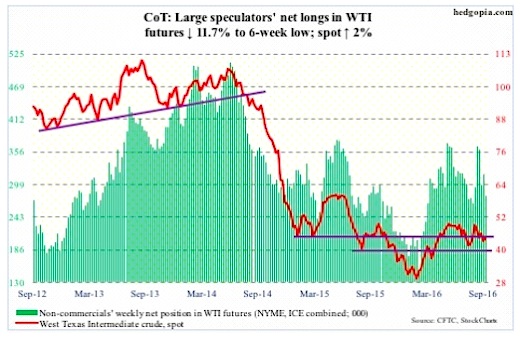
Spot West Texas Intermediate crude oil on Tuesday once again tested support at $43-$43.50, which held. This was followed by recapturing of the 50-day moving average, which was again lost on Friday. Spot crude oil prices would have met the declining trend line drawn from the June 9th high of $51.67/barrel around $48, but retreated before reaching there, with the intra-day high on Friday of $46.55. The pattern of lower highs since that peak continues.
September 23 COT Report: Currently net long 280.2k, down 37.3k.
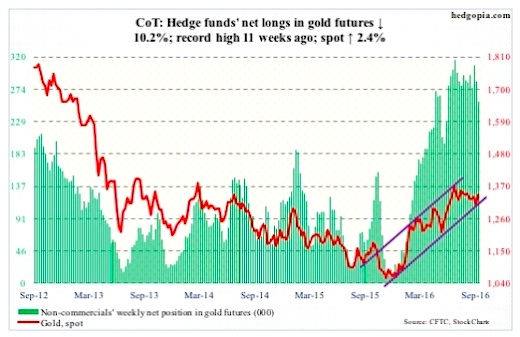
Gold: The $1,300/ounce level continued to provide support on spot gold prices. At the same time, it has been making lower highs since July 6th. A trend line drawn from that high would have been tested around $1,350, which also approximates the daily upper Bollinger band. On Thursday, gold prices rose to $1,347.8, before retreating slightly.
Gold is holding its own amidst increasing signs that central banks are nearing the end of the aggressive stimulus rope.
In the week ended Wednesday, the SPDR gold ETF (NYSEARCA:GLD), attracted $374 million (courtesy of ETF.com).
September 23 COT Report: Currently net long 256.2k, down 29.2k.
Thanks for reading.
Twitter: @hedgopia
Author may hold a position in mentioned securities at the time of publication. Any opinions expressed herein are solely those of the author, and do not in any way represent the views or opinions of any other person or entity.


