Copper prices have been surging in November. But despite the sharp rally, Doc Copper isn’t getting the attention it deserves.
That may be for a good reason, though. Copper prices have attempted (and failed) to break out of the 5-year downtrend channel several times (see chart below). Could this time be different? Will we soon witness history in the making? Depends on what the copper rally does here… and perhaps treasury yields as well.
At the same time that copper prices are rallying, so are 10 year treasury yields (i.e. interest rates). A breakout in copper prices AND interest rates could signal a new rising rate environment and have implications across asset classes. Although copper isn’t the economic bellwether that it once was, it’s interesting that both copper and yields are rising sharply together.
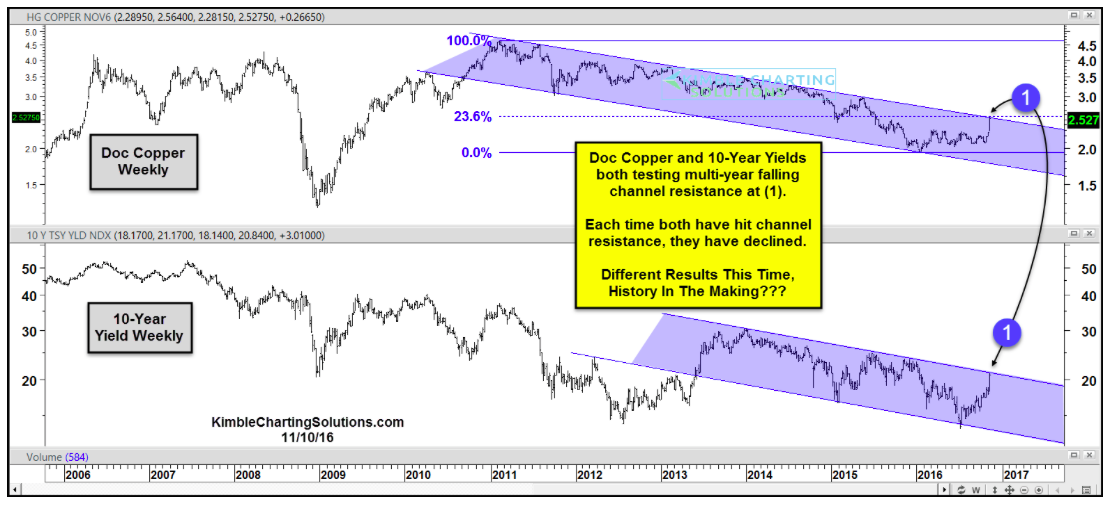
As you can see in the chart below, the rally has pushed Doc Copper and treasury yields up against falling resistance. Copper is also pressing up against a key Fibonacci resistance level (23.6%). If long copper here, it’s probably a good idea to take some profits and raise your stops (note that our subscribers have been long), as this is a big resistance area.
From a longer-term perspective, a breakout here for either (or both!) would change the investing playing field.
Copper vs 10-Year Yields – Weekly Chart
Thanks for reading.
Also from Chris: Amazon (AMZN) Price Reversal May Spell Trouble
Twitter: @KimbleCharting
Any opinions expressed herein are solely those of the author, and do not in any way represent the views or opinions of any other person or entity.

: Showing Some Signs of Emerging Strength")
