The reaction to Amazon’s earnings release was not good. The stock is currently trading down about 5 percent (at $776 mid-day Friday) and nearly 8 percent off its recent all-time highs. From a longer-term investing perspective, this move looks to be healthy and in-line with Amazon’s (AMZN) long term uptrend (higher highs and higher lows) over the past decade. It would take much more downside to change that.
However, from a near-term trading perspective, the Amazon stock price reversal could get some bearish traction. And traders (and investors) need to watch this development.
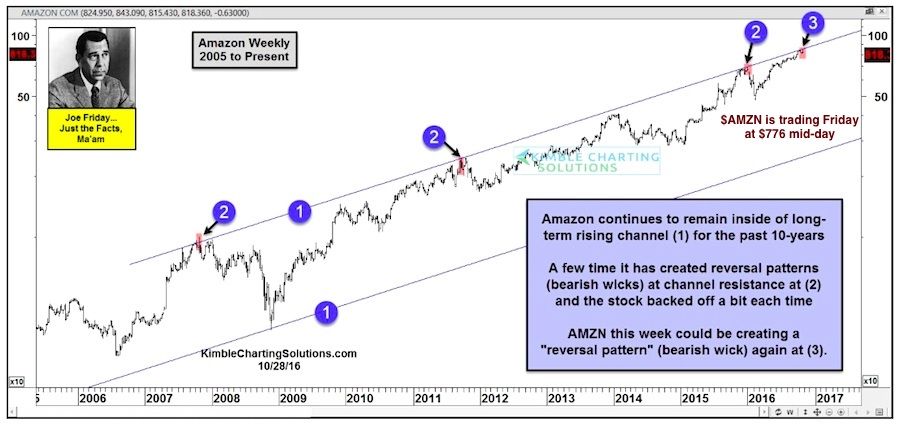
Amazon’s stock price was already dipping lower into the release, so this week could put in a bearish reversal pattern. As you can see in the chart below, this is a pattern seldom created, over the past 10-years.
Over the past decade, we have seen a few Amazon stock price reversals on a weekly candlestick basis (bearish wicks). All produced short-term highs (see all points marked 2 on the chart below). And Amazon (AMZN) could be creating another weekly reversal pattern near its decade long rising trend channel resistance (point 3).
In my humble opinion, this price action is a reason for caution (at a minimum), and perhaps for concern. As a tech stock leader, traders should put this on their radar.
Thanks for reading.
Also read: Amazon 3rd Quarter Earnings Key Takeaways
Twitter: @KimbleCharting
The author does not have a position in mentioned securities at the time of publication. Any opinions expressed herein are solely those of the author, and do not in any way represent the views or opinions of any other person or entity.

: Showing Some Signs of Emerging Strength")
