A simple (but remarkably effective) bear trap has set up and snapped shut a dozen times over the last year. Now, just as bears begin to stir – especially over the manifest weakness in small cap stocks – it may be ready to spring again. And while it’s a development that recommends caution for market pessimists, for those looking to harvest shorts, enter long or add on a broad-based pullback, this signal of danger can also equal opportunity.
Following the script written by Monday and Tuesday to the letter, the Russell 2000 Futures (TF) rose amidst a positive tone during European AM trade on Wednesday (dashed gray lines, below), leading to IWM‘s fourth (and at +0.61%, largest) consecutive gap-up. Just like on those days, the buoyant open was sold hard (dashed white lines) but stabilized just before the European close at trend line support near 1167, following Monday and Tuesday’s carbon-copy sessions scene-for-scene.
And then – in a departure from the carefully delineated lines left behind by the first half of the week – just as the Russell hit the now-predictable lunchtime cue (dashed blue lines), it began to improvise:
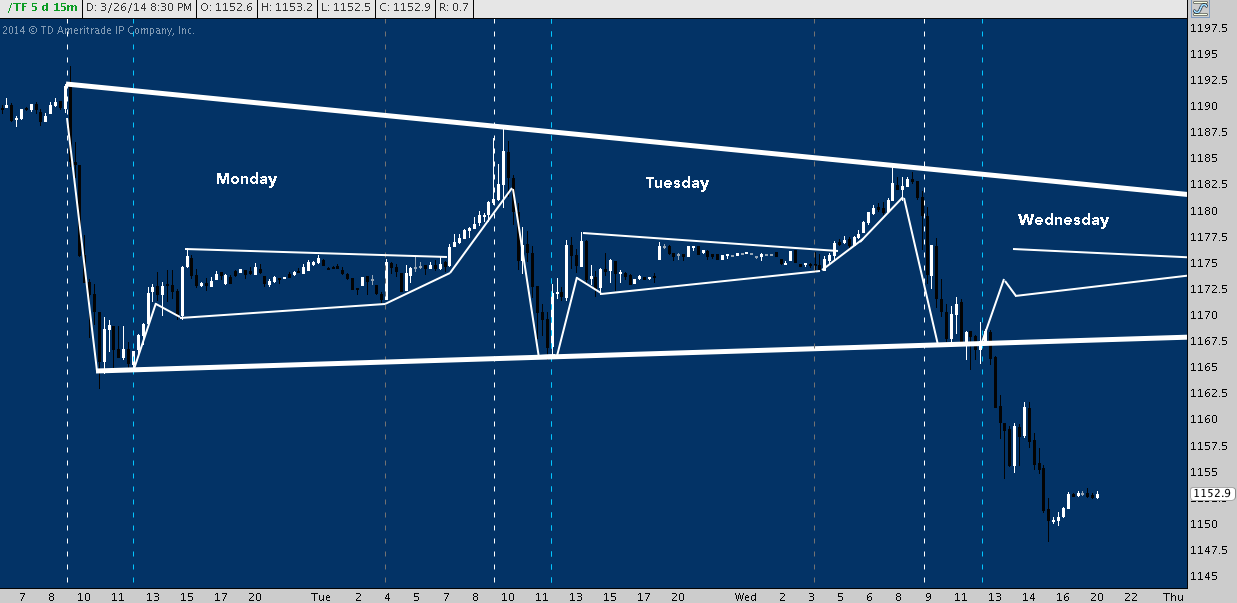
In the end, IWM shed -2.5% to close at 114.69, installing it’s worst day since February 3rd and fourth-worst single-day performance of the last 12 months. Despite some mid-afternoon indecision (visible above between 1-2 p.m.), the Russell ultimately lost it’s 50-Day Simple Moving Average (SMA).
As a widely-followed baseline of medium-term trend strength and direction, the 50-Day SMA is generally viewed as a fulcrum point. While price is above the SMA, the trend is affirmed and posits a bullish outlook; and where price crosses below, the trend – if not broken outright by also violating a rising trend line and/or installing a lower low – is teetering and is regarded as a bearish development.
Naturally, then, Wednesday’s break of the 50-Day SMA is bearish, right? According to recent history, it means anything but.
Since the beginning of 2013, IWM has now lost it’s 50-Day SMA on 13 distinct occasions. The chart below notes the 12 previous occurrences. Given the prevailing trend over this time period, it’s easy to surmise without even looking how these breaks ultimately turned out:
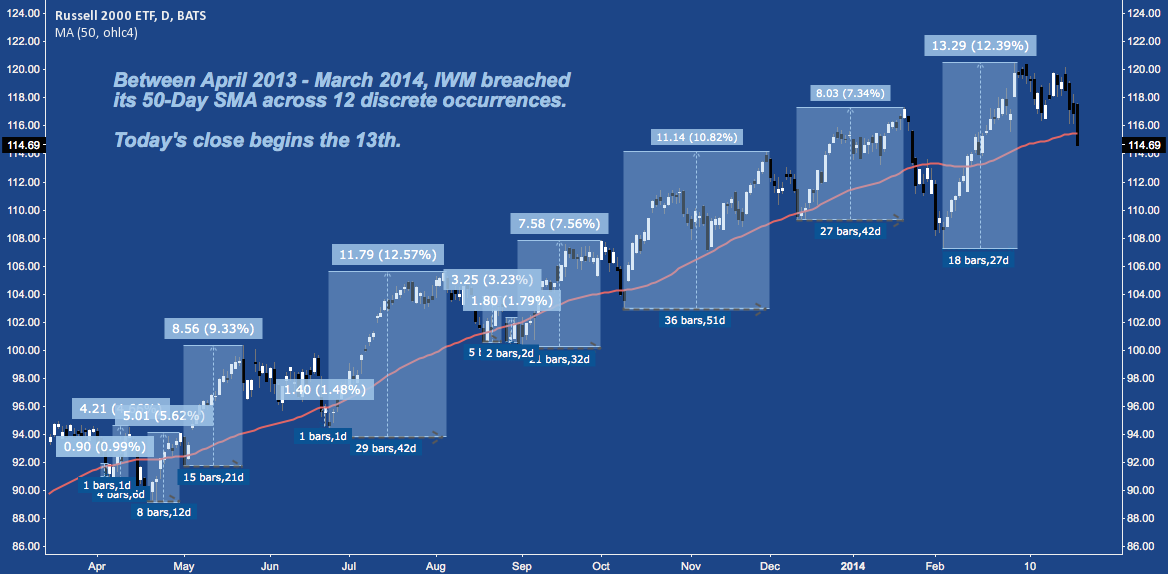
I can think of no simpler, more reliably bullish signal over the last year than the repetitive bear trap that is an IWM close below the 50-Day SMA.
Here’s how these 12 occurrences break down:
How long does IWM spend below its 50-Day SMA?
- Shortest duration (daily closes) spent beneath the 50-Day SMA: 1 (April, June 2013)
- Longest duration (daily closes) spent beneath the 50-Day SMA: 13 (February 2014)
- Average duration (daily closes) spent beneath the 50-day SMA: 2
How does IWM perform while below its 50-Day SMA (from break to absolute trough)?
- Best performance: -0.44% (December 2013)
- Worst performance: -5.19% (February 2013)
- Average performance: -1.73%
On average, then: IWM spends 2 days below it’s 50-Day SMA, losing -1.73% over that period.
How does IWM perform peak-to-trough? The numbers are worse, but not by much:
- Best performance: -1.64% (April 2013)
- Worst performance: -8.61% (January-February 2014)
- Average Performance: -2.91%
How long is IWM’s decline (in days) from peak-to-trough?
- Shortest duration: 2 (Aug 2013)
- Longest duration: 21 (May-June 2013)
- Average duration: 7.3
As pullback/bear trap/dip-buying opportunities, what happens once these bottoms are in? Measuring from IWM‘s absolute trough below the 50-Day SMA to its subsequent peak (with “peak” defined as the absolute high reached prior to the next incursion below the 50-Day SMA), here’s how these 12 occurrences have unfolded:
How long is IWM’s advance after bottoming below its 50-Day SMA?
- Shortest time to next peak (including bottom): 2 days (April, June 2013)
- Longest time to next peak (including bottom): 37 days (October-November 2013)
- Average time to next peak (including bottom): 15 days
How does IWM performance during these advances after bottoming below its 50-Day SMA?
- Best performance: +12.39% (February-March 2014)
- Worst performance: +0.99% (April 2013)
- Average performance: +6.48%
- Average daily performance given average time to next peak: +0.43%
In short, here’s the average “IWM broke it’s 50-Day!” scenario: the ETF closes below the 50SMA for 2 days and suffers a -1.73% loss before bottoming and embarking on a leg higher that is 7.5x longer and sports a gain outpacing the loss by 274%.
I’ll leave the details to the discovery of those who are interested: suffice it to say, the makings of a fantastic risk-managed long trade are here.
What’s the absolute worst case scenario, cherry picking data points from among these 12 periods? 13 days below the 50SMA, losing -5.19% before bottoming and then rising +0.99% over the next 37 days. That’s the description of an all-but-worthless rangebound market; but even this really isn’t so calamitous.
If you’re thinking this all sounds a little too well-assured that the benign, low-vol permabid grind described above will continue: I’d agree. Those are the stats of the prevailing trend: and for those who trade with the trend (i.e. for 98% of those who survive in the market), these are the numbers that matter right now.
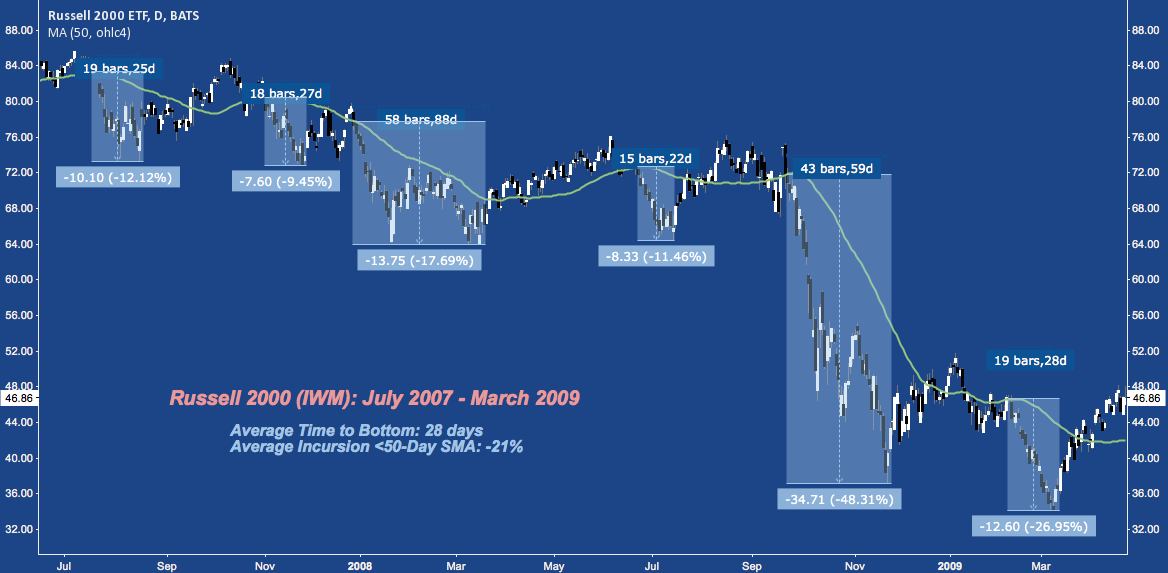
But it’s worth remembering the current, repetitive bear trap trend could transition from this…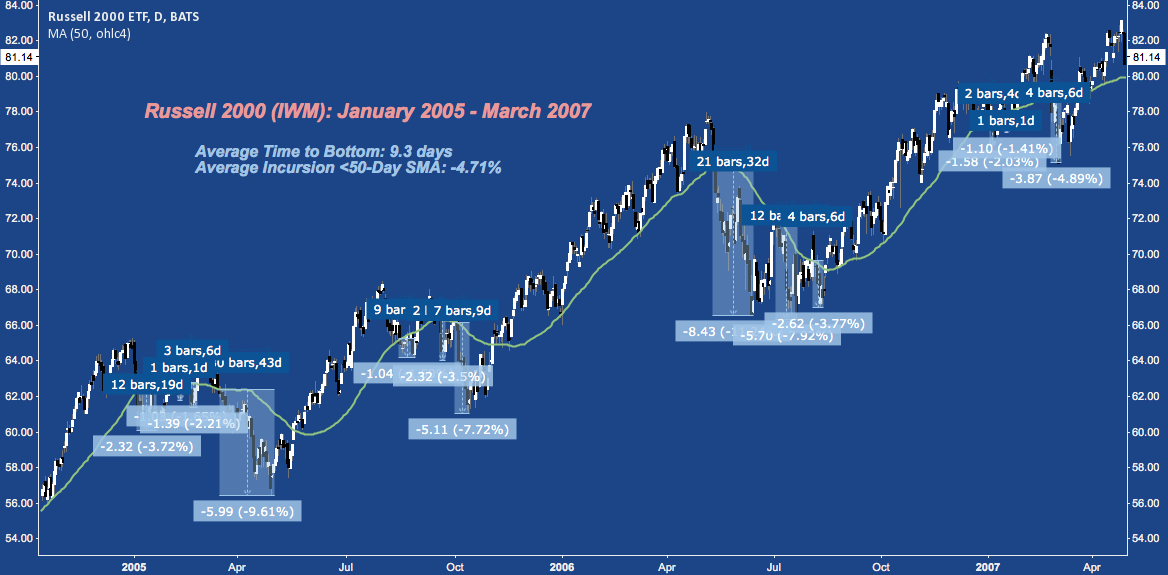
…Into this (conversely, here the breaks above the 50-Day were bull traps):
Looking at the current incursion: IWM finished Wednesday as the 17th day off its recent (and ATH) high in a -4.95% pullback, making it the 2nd longest (longest: 21 days) and 4th deepest (worst: -8.61%) of 13 occurrences. Pullbacks ranking 2nd and 3rd worst were -5.76% (April 2013) in 6 sessions and -5.0% (May/June 2013) in 21 sessions.
Though it may not feel like it (probably because the S&P 500, by comparison, is only 4 days and -1.67% off is own ATH), the current IWM sell off is already one of the worst of the last 15 months. All else being equal, this signals the pullback could almost be over.
I’ll mention one indication here that suggests there’s further downside: the Head & Shoulders Top building out on TF over the last couple weeks activated today with a break below its 1167 neckline (and the 03/03/14 “Crimea Occupation” left shoulder low at 1162.1). Major near-term horizontal support comes in off late January/mid-February at 1140; but below there the H&S has 1120 as a primary measured move target (corresponding another rung of support given off in late January/mid-February).
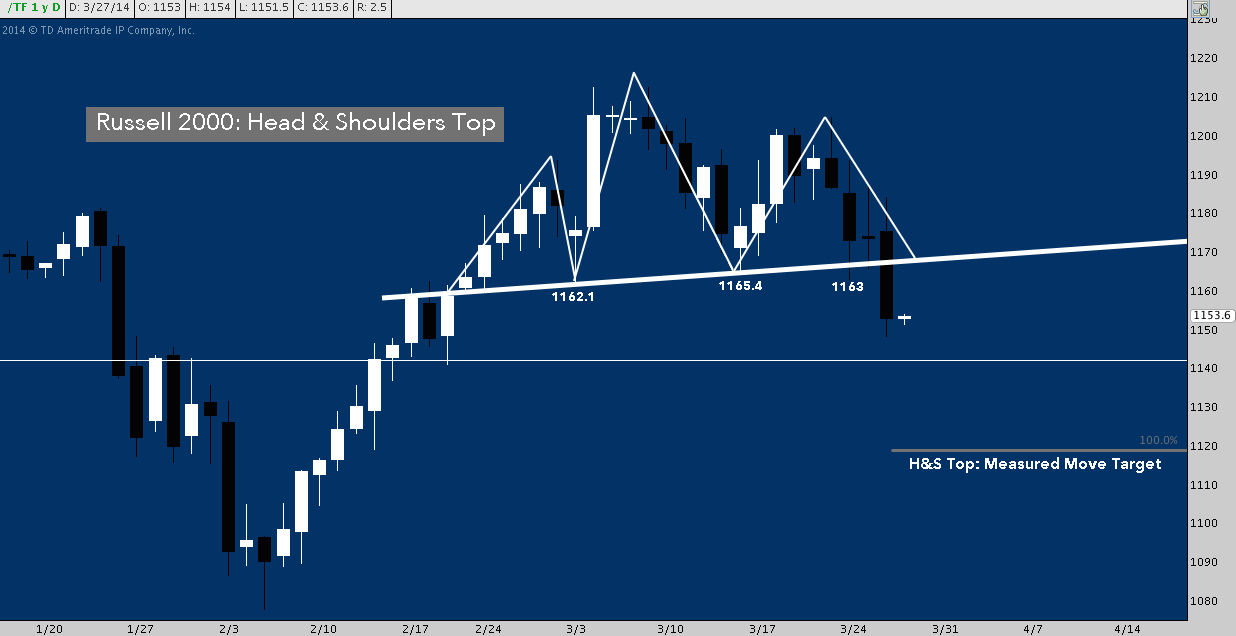
At -7.7% off 03/07/14’s all-time high and less than -3% from the low Wednesday left off with, H&S Top follow-through here is a simply-conceived scene that may unfold over the next few sessions; perhaps setting the dramatic tension for the now-classic bear trap to make yet another appearance.
Twitter: @andrewunknown and @seeitmarket
Author carries net short Russell 2000 exposure at time of publication. Commentary provided is for educational purposes only and in no way constitutes trading or investment advice.
Charts courtesy ThinkorSwim and tradingview.com. “Trap” image courtesy of loans.org.
Any opinions expressed herein are solely those of the author, and do not in any way represent the views or opinions of any other person or entity.

: Creating Bullish Divergence?")

: Creating Bullish Divergence?")


