 By Andrew Nyquist
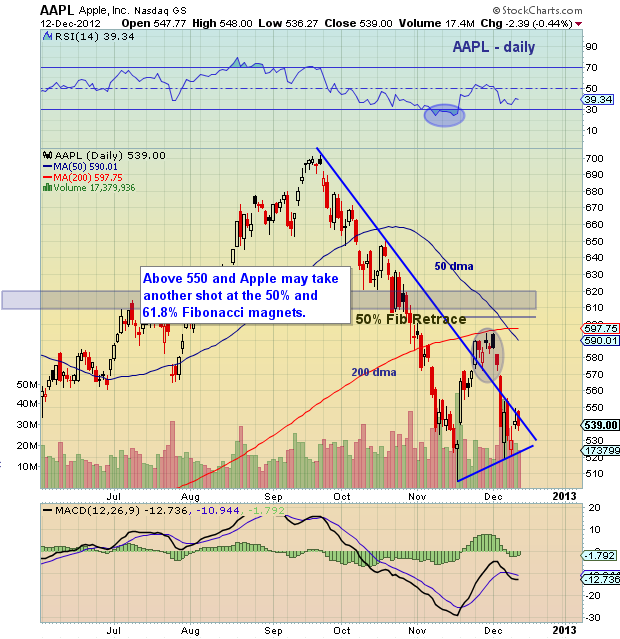
In our last technical update on Apple (APPL) the stock was readying to break out above its downtrend line and take on the 50 percent Fibonacci retracement magnet. However, not all break outs are equal, and the move above the downtrend line (highlighted below) turned into a false breakout; the stock made it to the 50 day moving average and stalled. (previous AAPL Technical Update)
Since then, Apple dropped down and retested the lows, thus far putting in a tenuous higher low. Extending the trend lines, we can identify some key levels to watch over the coming days. First of all, a move back over the downtrend line (call it $545) would be constructive, but to be safe, I’d say a move over $550 is necessary to fire the engines for another shot at the 50 percent Fibonacci level. Above that is the 61.8 Fib and key congestion zone up to $620. But that is getting ahead of the here and now so watching $550 overhead will suffice.
On the downside, active investors should be watching the tenuous uptrend line around 523 and the recent higher lows ($518.63).
Trade safe, trade disciplined.
Apple (AAPL) stock chart posted on December 13, 2012. AAPL technical support and resistance levels with trend lines, key Fibonacci levels, and technical analysis.
Twitter: @andrewnyquist and @seeitmarket Facebook: See It Market
No position in any of the securities mentioned at the time of publication.
Any opinions expressed herein are solely those of the author, and do not in any way represent the views or opinions of his employer or any other person or entity.


