This chart comes from the latest edition of the Weekly Macro Themes in which I talked about why another Federal Reserve rate hike is inevitable based on a couple of key charts which show an increasingly tight US labor market and a general rise in inflationary pressures.
For most investors what they really care about is not so much what the economic trend is or what a central bank will do per se, they care about the “So What?”. Today’s chart looks exactly at that question in regards to Fed rate hikes and the stock market.
The chart below shows an unusual indicator, let’s call it the ‘Fed sweet spot’ indicator. It takes the rate of wage growth (using the Atlanta Fed version in this case) and subtracts the Fed Funds target interest rate.
The logic is an environment where wage growth is high and interest rates are low should be positive for equities one way or the other (through flows and/or improving economics). On the other hand if either interest rates rise too much and exceed the pace of wage growth or if wage growth rolls over and rates aren’t cut quickly enough it will create a bearish macro dynamic for the stock market.
At present the indicator is still in the sweet spot, and while it has come down, it’s still far from the levels seen around the 2000 or the 2007 market tops.
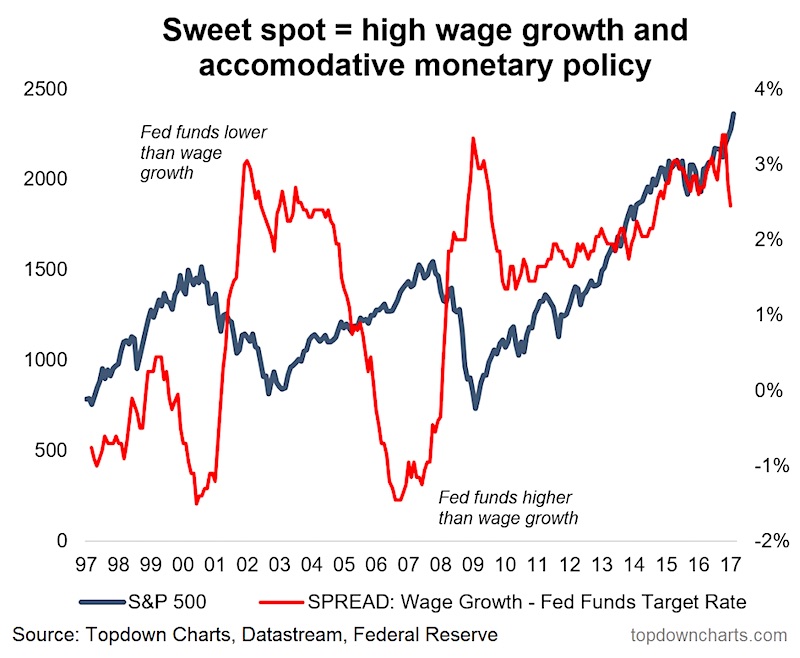
So the Fed sweet spot indicator is still supportive for stocks & the S&P 500 – at least for now – and it will take more than just one rate hike to sink it down to levels seen at the previous two major market tops. So go ahead Yellen, make our day.
If interested, check out my Weekly Macro Themes – you can request a trial here.
Twitter: @Callum_Thomas
Any opinions expressed herein are solely those of the author, and do not in any way represent the views or opinions of any other person or entity.
 Rolling Over At Key Fibonacci Level?")


