 Will 2014 evolve into a continuation of or a clean break from the S&P 500’s 2013’s performance? What impact will the so-called January Effect have on the remainder of the year?
A lot of ink continues to be spilled in consideration of these questions, mostly in the interest of developing an overarching market theme for the year. And no wonder: after a year spent on rails screaming higher, benchmark US equity indices have sloshed around aimlessly for most of January in marked contrast to late December. Naturally then, market players are looking for some narrative cohesion and a guiding sense of direction.
Despite this hyper-granularized analysis of “how January is behaving” and full-year “what a January performance of x means” extrapolations, the S&P 500 seems content to continue right where it left off last year (if we can say stocks “left off” anywhere, at all).
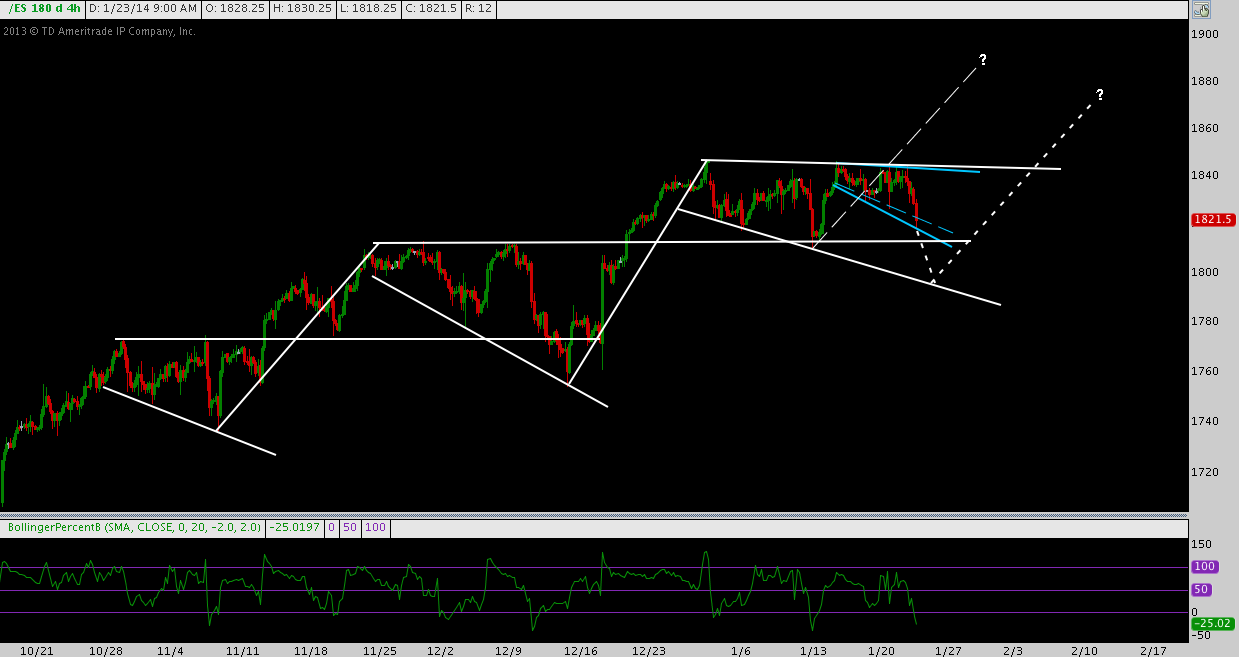
After early October 2013’s pullback low, S&P 500 e-mini futures (Symbol: ES) have gone on to install 3 consolidation patterns: either Descending Broadening Wedges (DBW) or Right-Angle Descending Broadening Formations (RADBF), depending on how you draw and how closely your interpretation adheres to pattern archetypes.
In either case, the first 2 of 3 broke higher, leading to 2014 and the current pattern (and the smaller pattern within that pattern, noted in blue):
Without looking at the date axis, it’s very tough to discern where one year ended and the other began. In fact, given the time symmetry evident in these broadening formations January’s tepid performance (thus far) looks to be nothing more than a function of the current pattern’s consolidation.
As for levels, ES may find support inside the blue pattern it’s currently muddling through; or it may dip (as the previous pattern did) below the horizontal support given off by the last pattern at 1810 to its lower trend line near 1785-1790 before find it’s footing.
If this pattern does give out, that will denote a major deviation from 2013’s character and justifiably opens the floor to a more bearish discussion. Until then, the current up-trend and it’s remarkably tight rhythm of ‘corrective pattern down, then motive leg higher’ remains the topic of conversation.
Twitter: @andrewunknown and @seeitmarket
Author holds no exposure to instruments mentioned at the time of publication. Commentary provided is for educational purposes only and in no way constitutes trading or investment advice.
Any opinions expressed herein are solely those of the author, and do not in any way represent the views or opinions of any other person or entity.
: Creating Bullish Divergence?")


 and Semiconductors (SMH): Concerning Price Pattern?")


