During the past 6 months, the stock market has lost some momentum. It’s basically traded sideways and this has allowed several trend lines to play catch up and come into view. Today, I’ll focus on a couple of important sector ETFs that are meeting up with their trend lines from 2009: 1) the Financial iShares ETF (IYF) and 2) the Utilities Sector SPDR ETF (XLU).
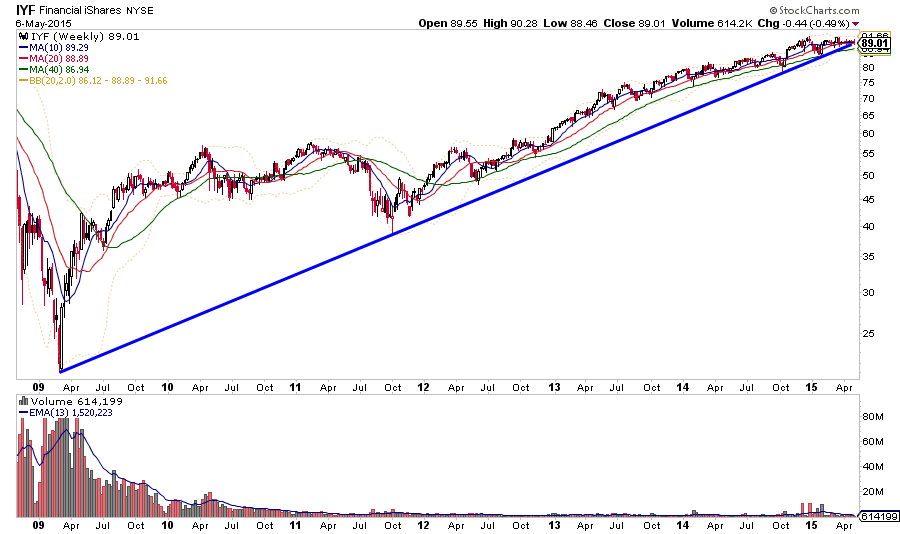
First, let’s start with IYF. Of late the bounces off this trend line have become weaker and are occurring more frequently.
What really stands out is the winter trend line test has NOT led to new highs. If the trend line is lost, 85-86 is the next thick area of price support.
Financial iShares ETF (IYF) Long-Term Chart
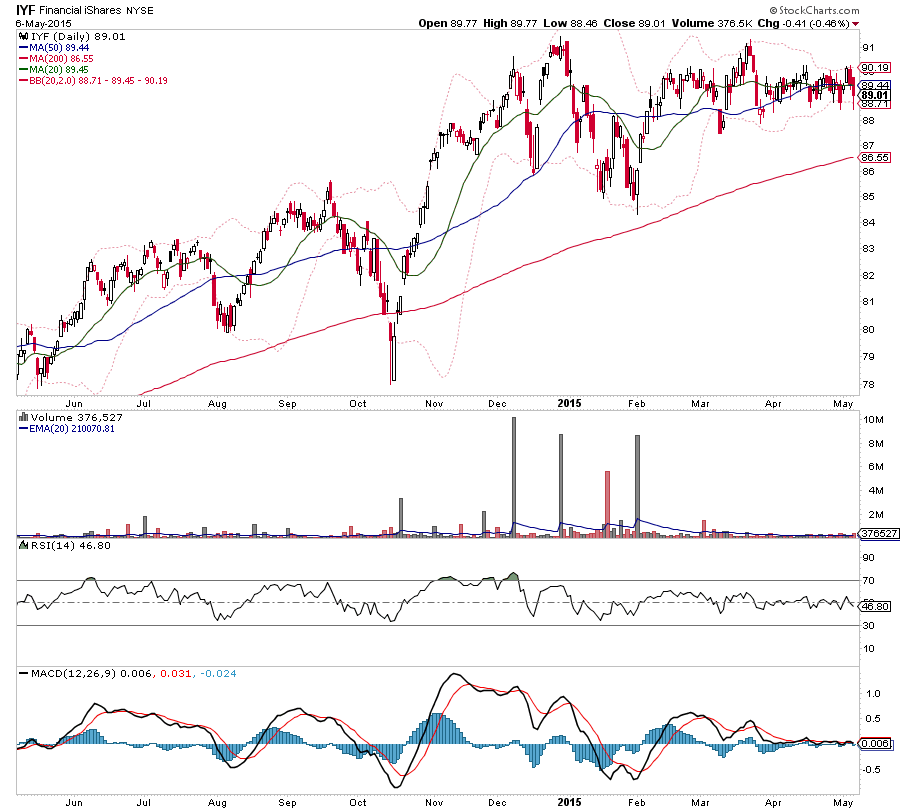
Also note how tight the recent price action has been on the 1 year daily chart.
Financial iShares ETF (IYF) 1 Year Daily Chart
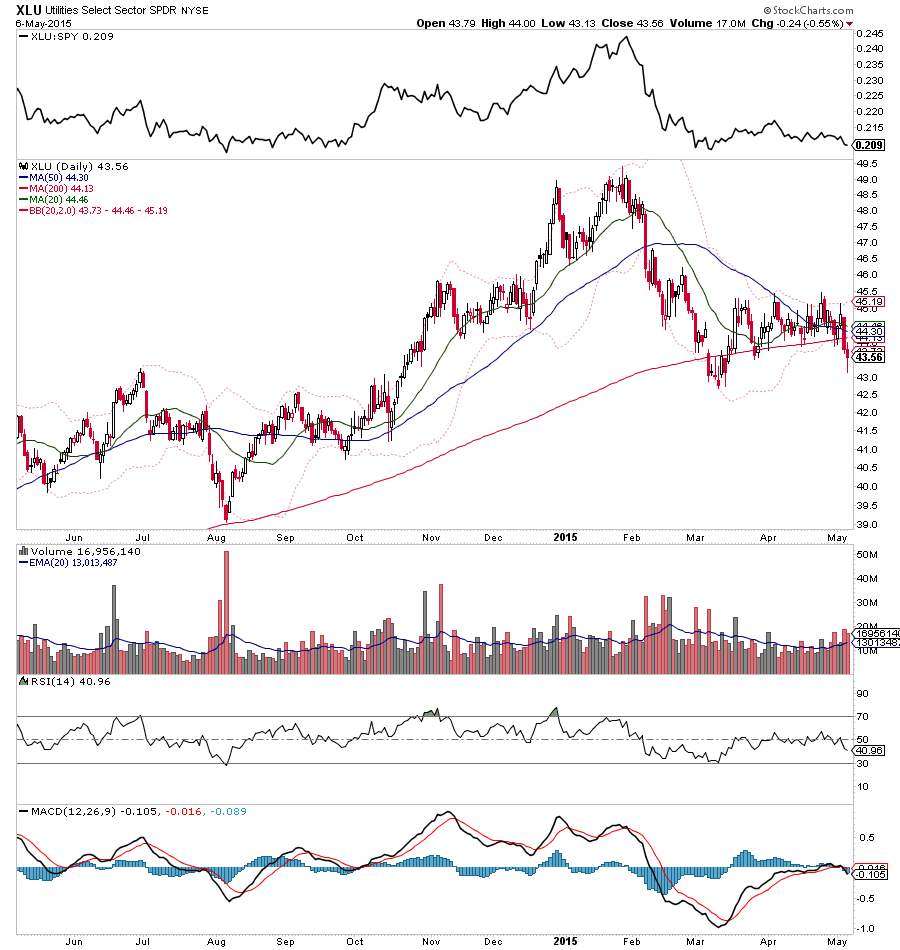
On to XLU. Like IYF, the winter trendline bounce hasn’t led to a new high… but XLU is noticeably weaker.
The price action has been similar to that of 2013.
Utilities Sector SPDR ETF (XLU) Long-Term Chart

Looking at the daily chart of XLU, we can see that it punctured its late March pivot low and is threatening to test its all important March lows.
Utilities Sector SPDR ETF (XLU) 1 Year Daily Chart
The main takeaway here is it’s an important time across several sector ETFs and the market. Volatility is picking up on the daily charts. There should be some great trading opportunities this summer!
Thanks for reading!
Follow Aaron on Twitter: @ATMcharts
No position in any of the mentioned securities at the time of publication. Any opinions expressed herein are solely those of the author, and do not in any way represent the views or opinions of any other person or entity.
: Cup (and Maybe Handle) Watch")
 Trading Near Top Of Price Range")
 Reaches Important Price Support")