Back on October 7, I wrote this piece that focused on two bearish indicators and I said we could see some near-term weakness in the market. After a quick 4% drop in a week, we bounced and formed a nice looking V-bottom.
Check out this chart of the S&P 500 (SPX):

I said at the time that I wanted to see both the CBOE options equity put/call ratio and the CBOE Volatility Index (VIX) switch to bullish before I could personally turn bullish again. Well, we could be there.
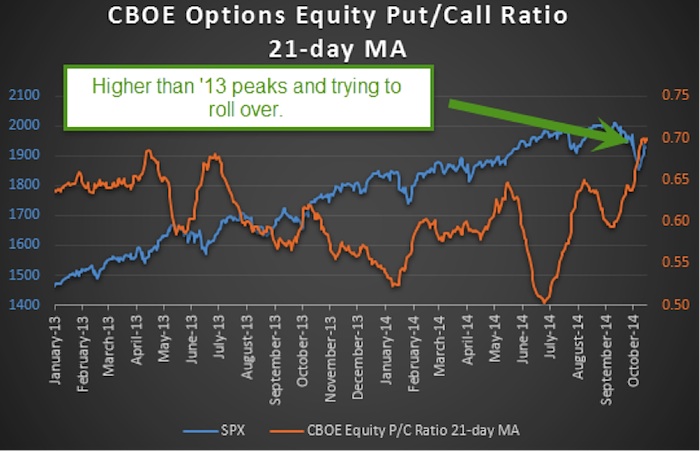
First up, the CBOE equity put/call ratio is one of my favorite indicators, mainly because it has been so accurate in 2014. I use a 21-day moving average to smooth the data. What I’ve found is this ratio tends to trade inversely with the S&P 500. Think of it like this, when everyone is bearish and the put/call ratio is high, this is potential buying pressure once those bearish bets are unwound. Once this happens, the ratio can move lower and with it we have a higher SPX and stock market. The flipside is once it gets extremely low, everyone is a little too bullish.
Over the past 21-days we’ve seen more puts traded relative to calls over any time since at least the start of ’13. So besides this ratio being very high (and that suggests a lot of fearful option traders out there), this ratio is also trying to roll over from the high level. This could be a very bullish development for the historically bullish November/December timeframe as all that worry unwinds.
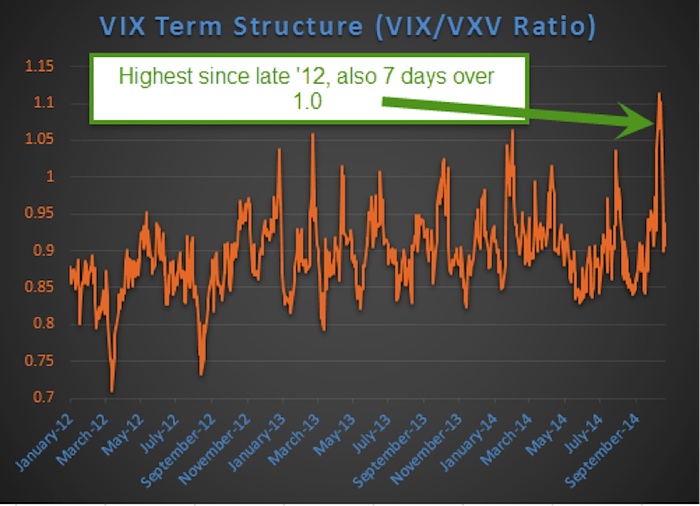
Next up is the VIX Term Structure. I look at it like this, it is how much traders are willing to pay for future volatility. When things are ‘normal’ this means near-term volatility is lower than further out volatility. The reason is the longer you hold something, the more time there is for some big event to happen that could cause volatility – so you tend to pay more for this. That makes a lot of sense if you think about it. The flipside is when there is a good deal of panic, we see this ratio become inverted. This is much rarer.
To measure this, I like to look at the ratio of the VIX and the CBOE S&P 500 3-month volatility (VXV). Let’s just call it the VIX/VXV ratio from here on out. Now remember, the VIX looks at volatility going out one month, while the VXV goes out three months. So should this become inverted, it shows there is a good deal of panic in the option market – as they are willing to pay more for near-term protection than further out months.
On October 9th this ratio became inverted and it actually stayed above 1.0 for seven days. This is a key point. In 2008 this stayed above the 1.0 level for an incredible 63 days. That took place as the S&P 500 crashed. In other words, you want this to spike above 1.0, but don’t want it to stay there.
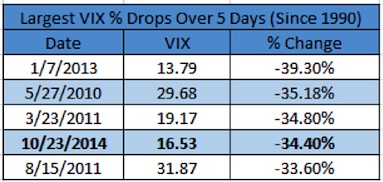
As you can see above, this ratio not only spiked above 1.0, but it also spiked higher than any other surge we’ve seen since at least 2012. In other words, the recent market weakness caused potentially more fear than we’ve seen in a very longtime. Again, that is a good thing as long as things calm down quickly afterwards. Well, the VIX just dropped 34.40% over the past 5-days, the 4th largest drop since 1990. I like seeing this.
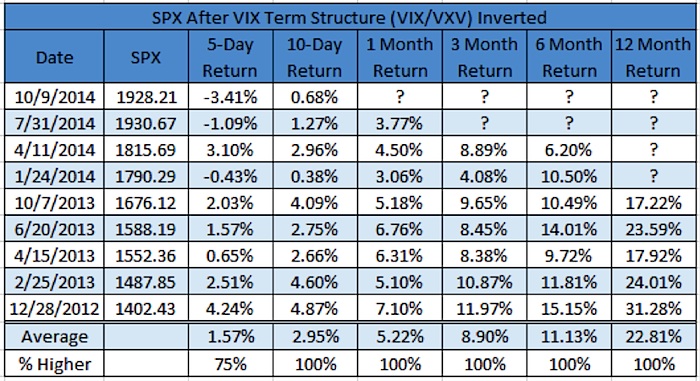
Here are the returns after the VIX term structure becomes inverted. The bottom line is this has been extremely bullish and the SPX usually bounces fast. In fact, every time the SPX has been green after 10 days. This time it just barely made it, but it still made it. Had it been red that could have been a warning this time is ‘different.’ All in all, this looks very good for much higher prices going out a few months.
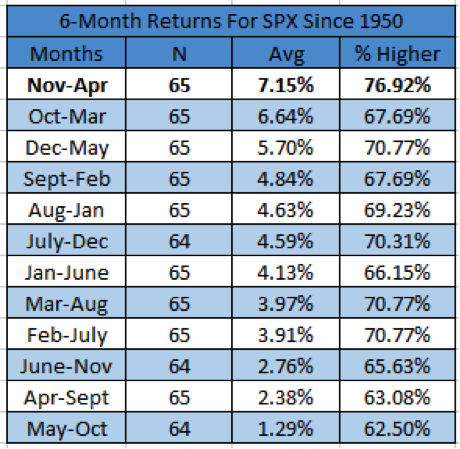
I’m one of the few anymore that think this bull market is still alive and well. As earnings and the economy continue to improve, this should be a major driver for higher equity prices over the coming months. Lastly, don’t forget we are about to enter the most bullish six month stretch for the stock market. Good luck in your trading.
Follow Ryan on Twitter: @RyanDetrick
No position in any of the mentioned securities at the time of publication. Any opinions expressed herein are solely those of the author, and do not in any way represent the views or opinions of any other person or entity.

: Showing Some Signs of Emerging Strength")
