Well, October so far is living up to its billing as the most volatile month for the stock market. As I noted coming into the month, October is usually a roller-coaster of a month, but it isn’t nearly as bearish for stocks as most think.
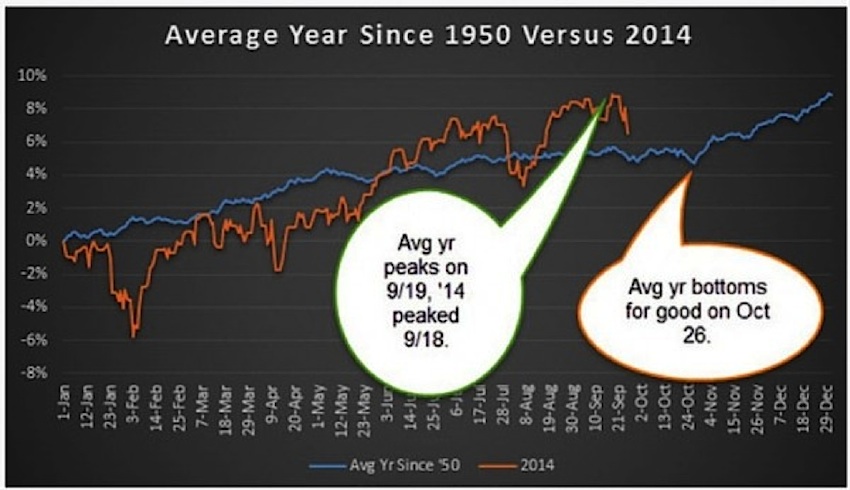
My favorite stat is the average year tends to bottom during the last week of October. And since the stock market peaked the third week of September (right on schedule) and the next few weeks are volatile and usually bearish, this seems to be playing out perfectly so far.
Here’s the visual of the average year since 1950 vs this year:
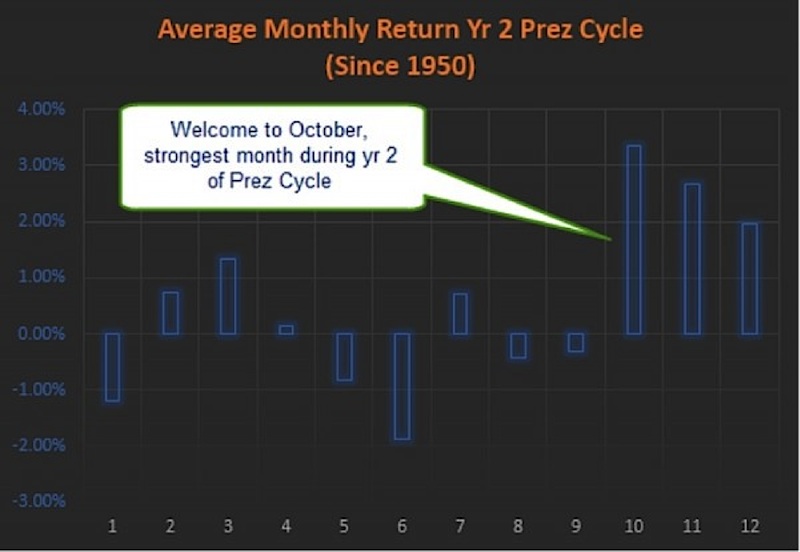
But don’t forget this is the second year of the Presidential cycle and that October is the strongest month of the year during these years. Also November and December are strong, so all isn’t lost for a potential year-end rally. We just might have to feel some more pain before it can happen.
Late last week on Yahoo Finance I listed some sentiment indicators that were flashing signs of fear finally coming into the market. That is a good thing, as fear tends to flush out the weak hands leaving nothing but buyers. The only problem is these next two charts, which continue to worry me in the near-term.
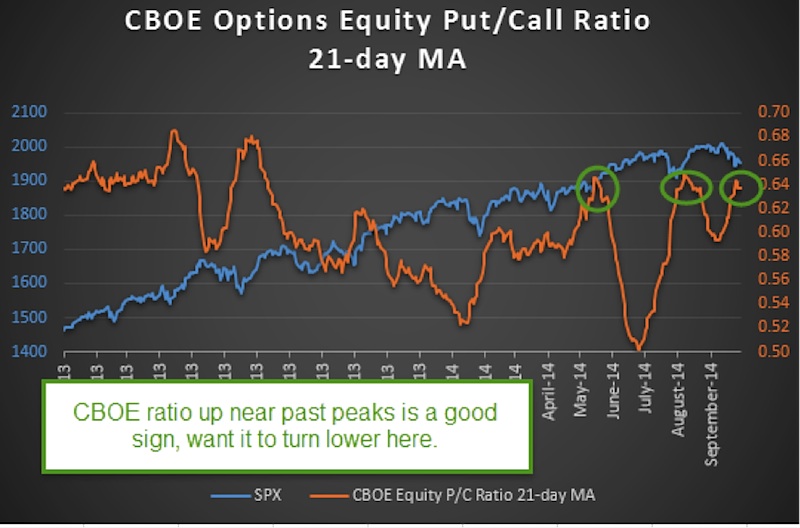
First up, one of my favorite sentiment indicators is the CBOE options equity put/call ratio. I use a 21-day moving average to smooth things out. To keep this simple, when this ratio trends lower – it has tended to be bullish for the S&P 500 (SPX). Think of it like this, when everyone is bearish and the put/call ratio is high, this is potential buying pressure once those bearish bets are unwound. Once this happens, the ratio can move lower and with it we have a higher SPX and stock market. The flipside is once it gets extremely low, everyone is a little too bullish.
Well, it is currently up near past major peaks, which could suggest there’s a good deal of fear in the options market. The big problem is it hasn’t clearly turned lower. I’d much prefer this take a solid turn lower before becoming extremely bullish equities.
Next up is the CBOE Volatility Index (VIX). I’m sure you’re all familiar with everyone’s favorite fear gauge. The problem is it didn’t quite flash the same level of fear on last week’s lows as I would have preferred. I like to look at the VIX term structure to get a true feel for how much fear/greed is out there.
To keep this simple, the VIX term structure shows how much traders are willing to pay for future volatility. When things are ‘normal’ this means near-term volatility is lower than further out volatility. The reason is the longer you hold something, the more time there is for some big event to happen that could cause volatility – so you tend to pay more for this. That makes a lot of sense if you think about it. The flipside is when there is a good deal of panic, we see this ratio become inverted. This is much rarer.
To measure this, I like to look at the ratio of the VIX and the CBOE S&P 500 3-month volatility (VXV). Let’s just call it the VIX/VXV ratio from here on out. Now remember, the VIX looks at volatility going out one month, while the VXV goes out three months. So should this become inverted, it shows there is a good deal of panic in the option market – as they are willing to pay more for near-term protection than further out months.
Here’s the chart. Since late 2012 this ratio has become inverted eight times. Those eight times also marked tremendous times get extremely long equities, as the crowed was panicking right at the exact wrong time.
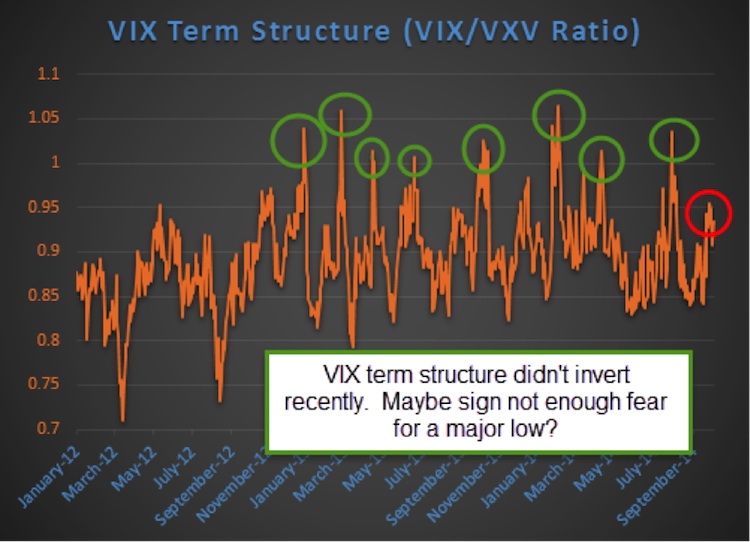
This doesn’t always work though, as many times in 2008 it was inverted and we just continued to crash. So as long as we’re still in a bull market (which I believe), inversions should be viewed very bullishly.
Did last week create enough fear in the stock market for a major low to form? Sure, it might have. But given the next few weeks are historically troublesome, I wouldn’t be shocked if we needed one more flush lower to shake out the weak hands. This could create the VIX inversion and signal it is finally time to get ready for the year-end rally.
Follow Ryan on Twitter: @RyanDetrick
No position in any of the mentioned securities at the time of publication. Any opinions expressed herein are solely those of the author, and do not in any way represent the views or opinions of any other person or entity.


