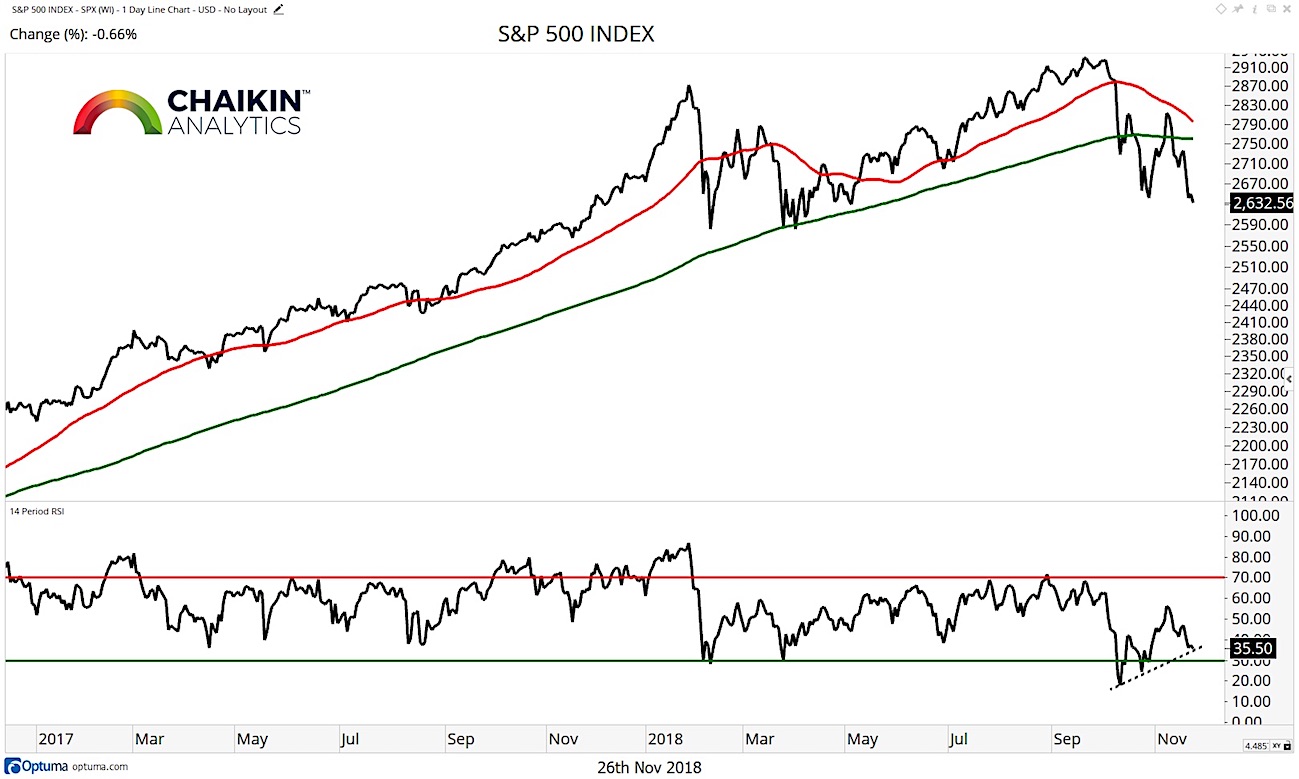
On a closing basis, the S&P 500 (INDEXCBOE: .INX) remains below the 50 and 200-day moving averages, both of which are declining.
Investors will now look for support in the area of the February and April lows (2,570 – 2,600) to hold.
Resistance comes into play near 2,700 and the burden of proof remains on the bulls to push the index through key resistance levels if a rally into the end of the year is going to begin.
One bright spot is that the RSI did not confirm the recent price low, leaving a positive divergence on the chart.
S&P 500 Chart
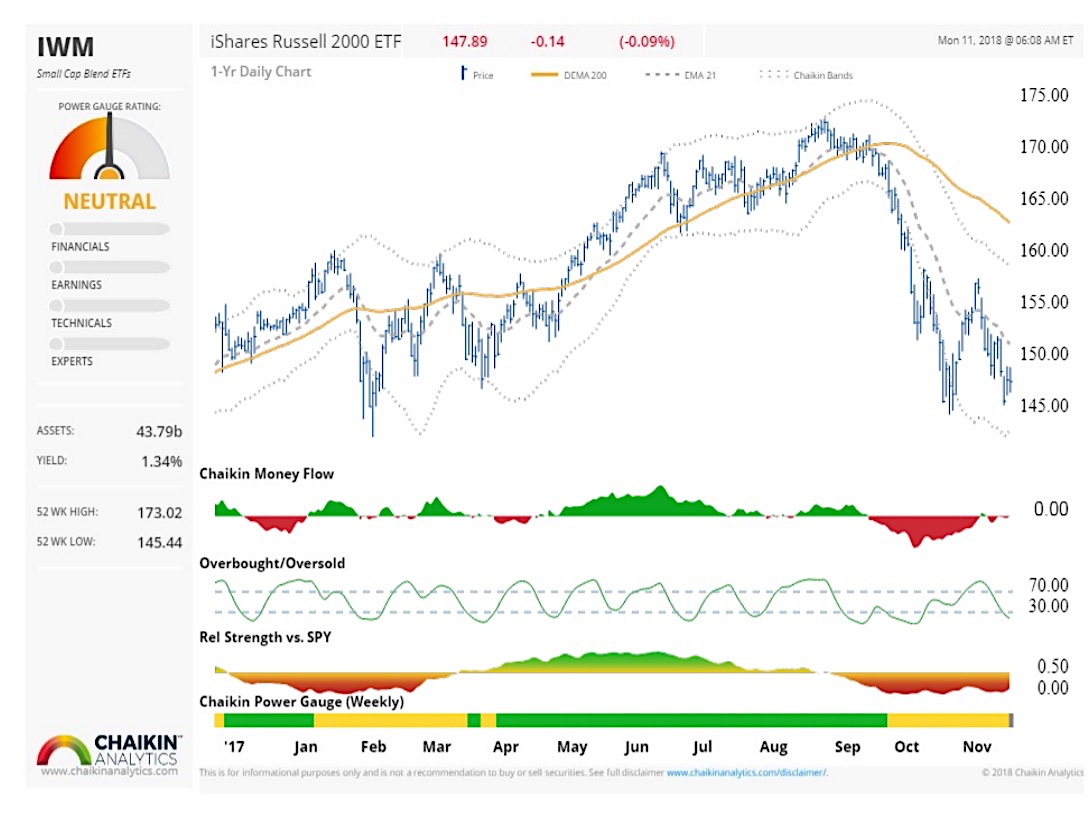
Small Cap Stocks
The iShares Russell 2000 ETF (NYSEARCA: IWM) continues to underperform the SPY but we are beginning to see the intensity of the underperformance lessen. The IWM has support near $145 while resistance comes into play near $155. The fund is oversold based on our indicator and Chaikin Money Flow is neutral.
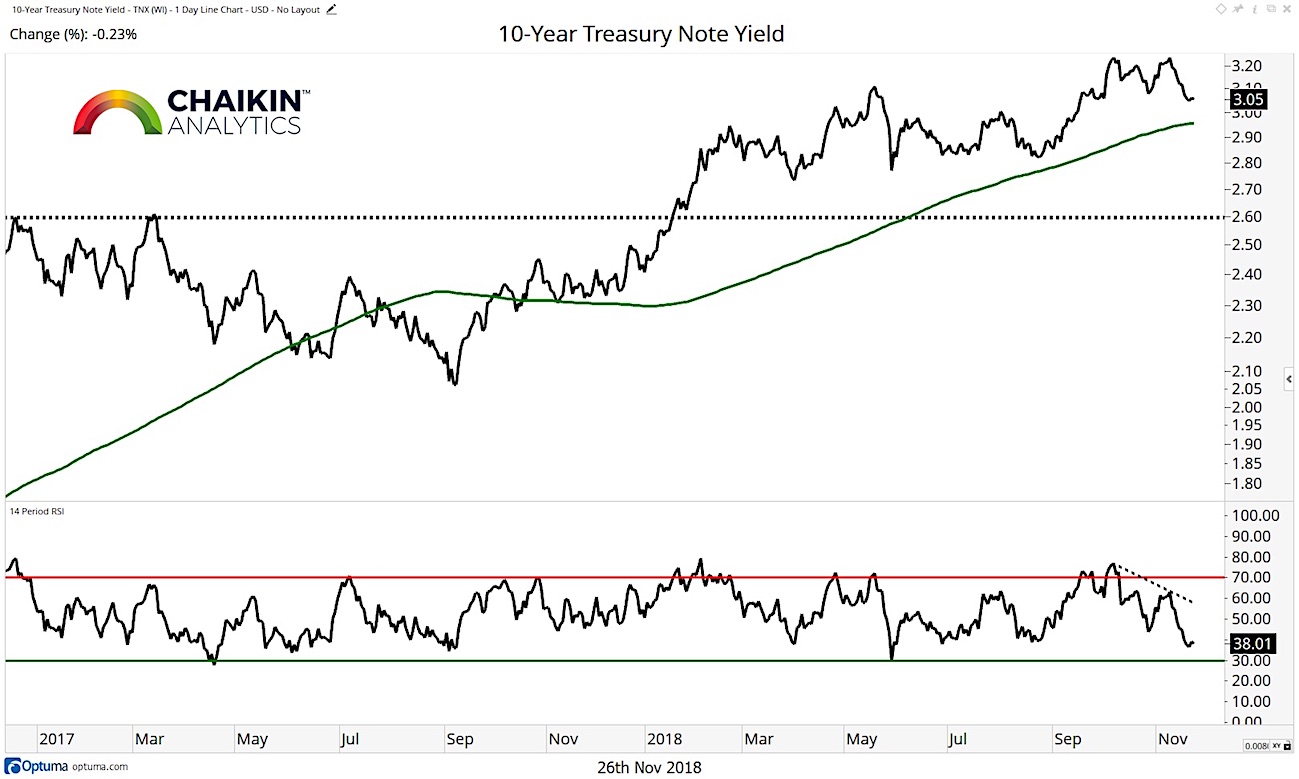
Fixed Income
The 10-year yield continues to fade from resistance near 3.23%, closing the week at 3.05% as investors continue to position portfolios in a defensive manner. The yield remains above the rising 200-day moving average and has support near the 3.0% level. The RSI made a negative divergence during the most recent move to the highs and is testing the lower end of bullish ranges. Longer term, the trend remains up and a retest of the recent highs can’t be ruled out.
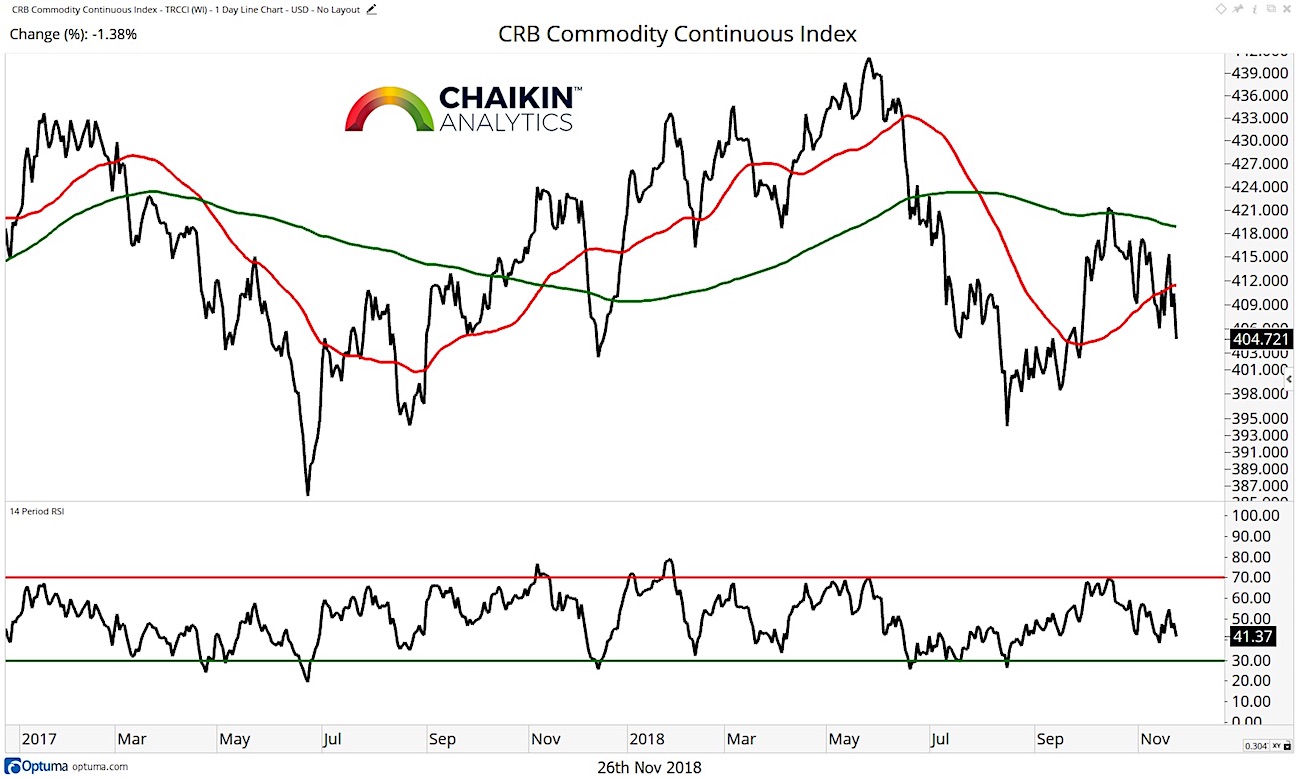
Commodities
The CRB Commodity Index has broken below support at the rising 50-day moving average and remains below the declining 200-day moving average as the fall in the price of oil has had a negative impact on the commodity complex. The RSI is in neutral ranges and has not become oversold as the price of commodities has declined over the past week.
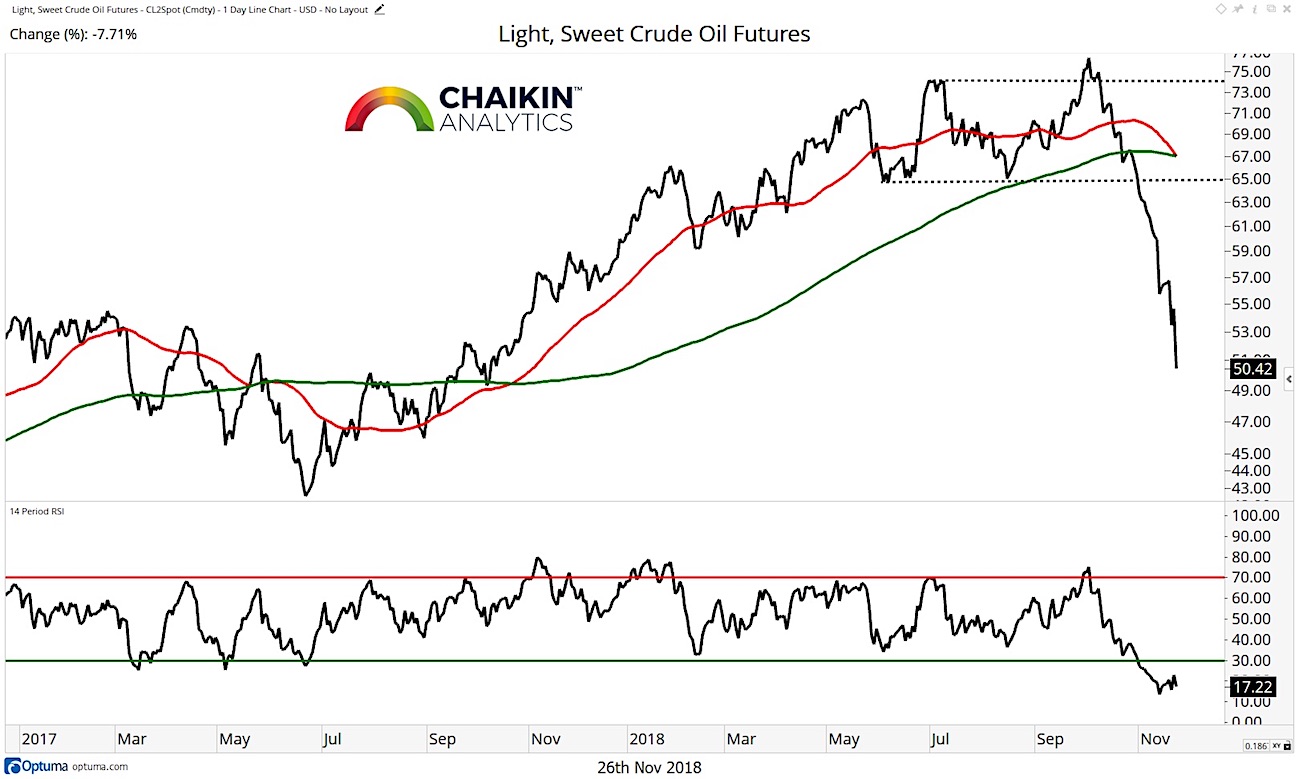
Crude Oil is now deeply oversold as it has fallen to test the $50 level after breaking support near $64. The 50 and 200-day moving averages are both declining, and the former is in the process of crossing below the latter. Given the oversold nature of Crude, we would expect to see a counter-trend rally develop this week but there has been a fair amount of technical damage done. Rallies can be used to reduce exposure in the energy sector.
The Dollar
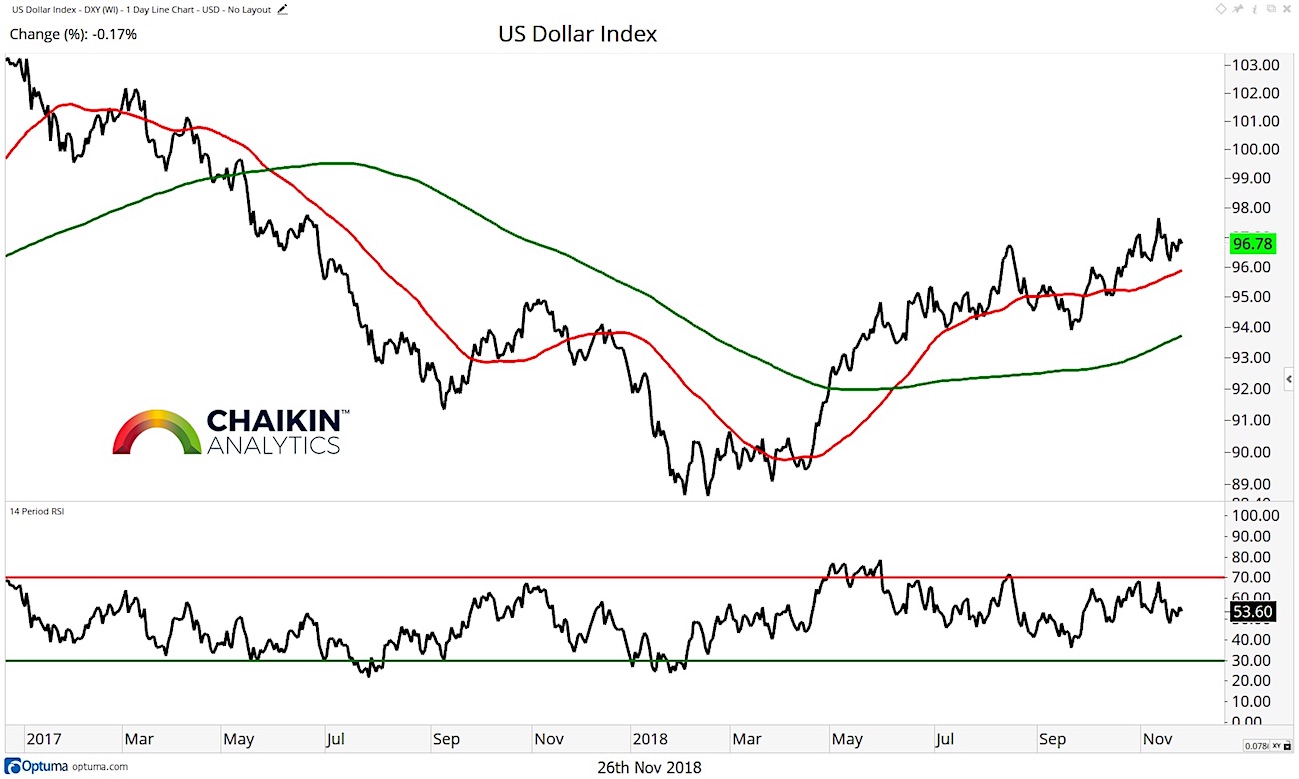
The Dollar Index remains above the rising 50 and 200-day moving averages as it continues in the uptrend which began in March. The RSI is in bullish ranges confirming the price trend. Continued strength in the price of the dollar should have a positive impact on the performance of small cap stocks relative to large cap stocks. We noted on Friday that small caps are testing and holding (so far) relative support.
Twitter: @DanRusso_CMT
Author may have a position in mentioned securities at the time of publication. Any opinions expressed herein are solely those of the author, and do not in any way represent the views or opinions of any other person or entity.


