After a long bout of trading sideways, Yahoo! Inc. (YHOO) appears to have broken from our targeted PATTERN to the downside. Note that I have covered this Yahoo sell pattern for some time (read more here) and would like to provide an update with some YHOO price targets in this post.
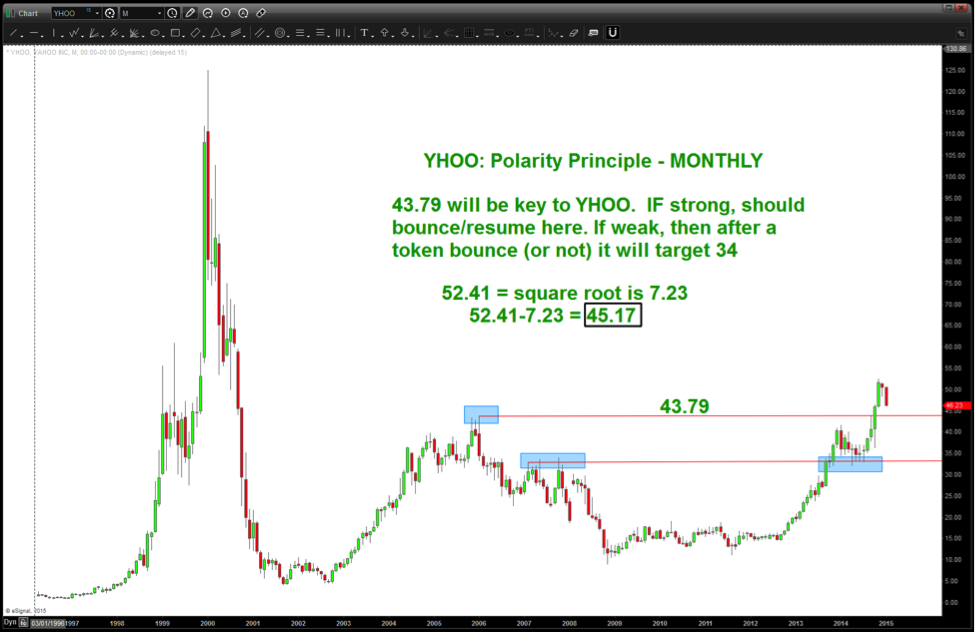
Per the chart below, the previous high into Jan 2006 ($43.79) will be key to enacting the polarity principle where former resistance becomes support. This level may be the main YHOO price target. Keep an eye on this level closely as the volume and price reaction to this price level will be a good indicator if the stock is going higher or lower.
Additionally, on the YHOO daily chart, there is an unfilled gap in and around $40-$42.
In a bull or bear market it’s not uncommon for price to make a correction equal to the square root of the former high or low. As you can see, a 7 dollar correction ($45.17) is a little lower than where we are today. Pay attention to that level as well.
And while we are on the subject, defy human nature and do the work. Check out what YHOO does every 723 minutes, 7.23 hours, 72.3 days, etc. moving forward.
If we lose the levels mentioned below, then the next YHOO price target would likely be around $33. We’ll adjust depending on whether the polarity principle is working or not.
Also read my recent post: Yahoo Topping Pattern Still In Play
Yahoo! Inc. (YHOO) Stock Chart click chart to enlarge
Thanks for reading.
Follow Bart on Twitter: @BartsCharts
No position in any of the mentioned securities at the time of publication. Any opinions expressed herein are solely those of the author, and do not in any way represent the views or opinions of any other person or entity.


 Analysis: Bulls Eye Down-Trend Line")


