Stocks continue to trade near all-time highs but breadth is showing some soft pockets. This means that traders need to be careful in understanding sectors/industries/areas of strength and picking stocks and ETFs based off strong setups.
One sector that has a strong setup is the Financials Sector (XLF).
The recent price action has been bullish, but one final hurdle remains for $XLF to breakout and confirm the recent “trading” buy signal that triggered when XLF broke above its down-trend.
As usual, I will use a chart to do most of the talking. A breakout here adds focus to this sector and traders mining for stock picks would look for relative strength leaders.
Note that the following MarketSmith charts are built with Investors Business Daily’s product suite.
I am an Investors Business Daily (IBD) partner and promote the use of their products. The entire platform offers a good mix of technical and fundamental data and education.
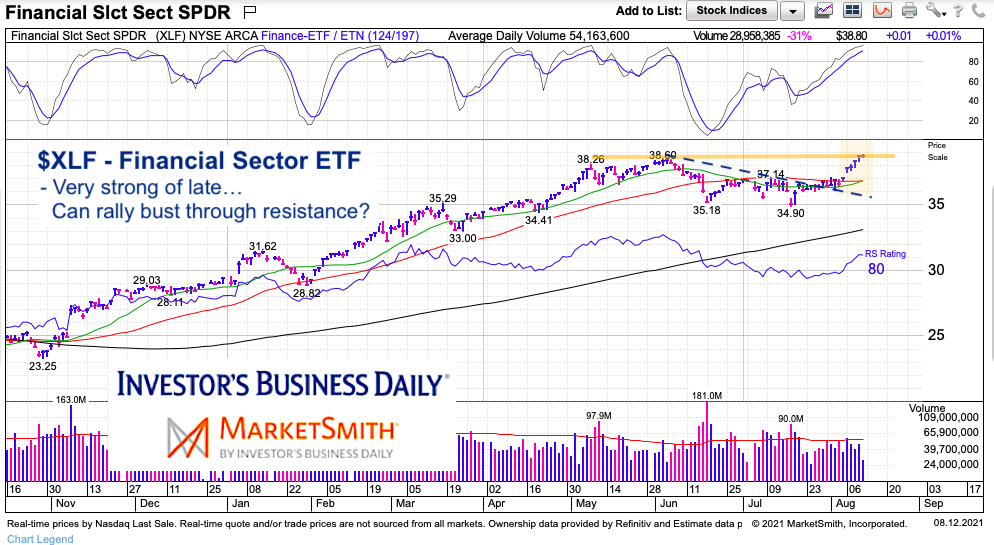
$XLF Financial Sector ETF Chart
Over the past two weeks, the Financial Sector ETF (XLF) took two big steps forward in triggering a buy signal. First, $XLF broke above its down-trend line. Second, it confirmed this move by trading back above its 20/50 day moving averages (MAs).
That momentum continued into this week, where the Financial Sector ETF finds itself attempting to breakout above its June highs. To be clear, this area is resistance and likely served as a trading price target for the initial buy signal(s). That said, making new highs (and holding them) is a sign of strength. Put $XLF on your radar.
Twitter: @andrewnyquist
The author may have a position in mentioned securities at the time of publication. Any opinions expressed herein are solely those of the author, and do not in any way represent the views or opinions of any other person or entity.


