The Wilshire 5000 is a must-follow stock market index that measures the market in its broadest form.
So when this index flashes caution, it’s best that investors pay attention.
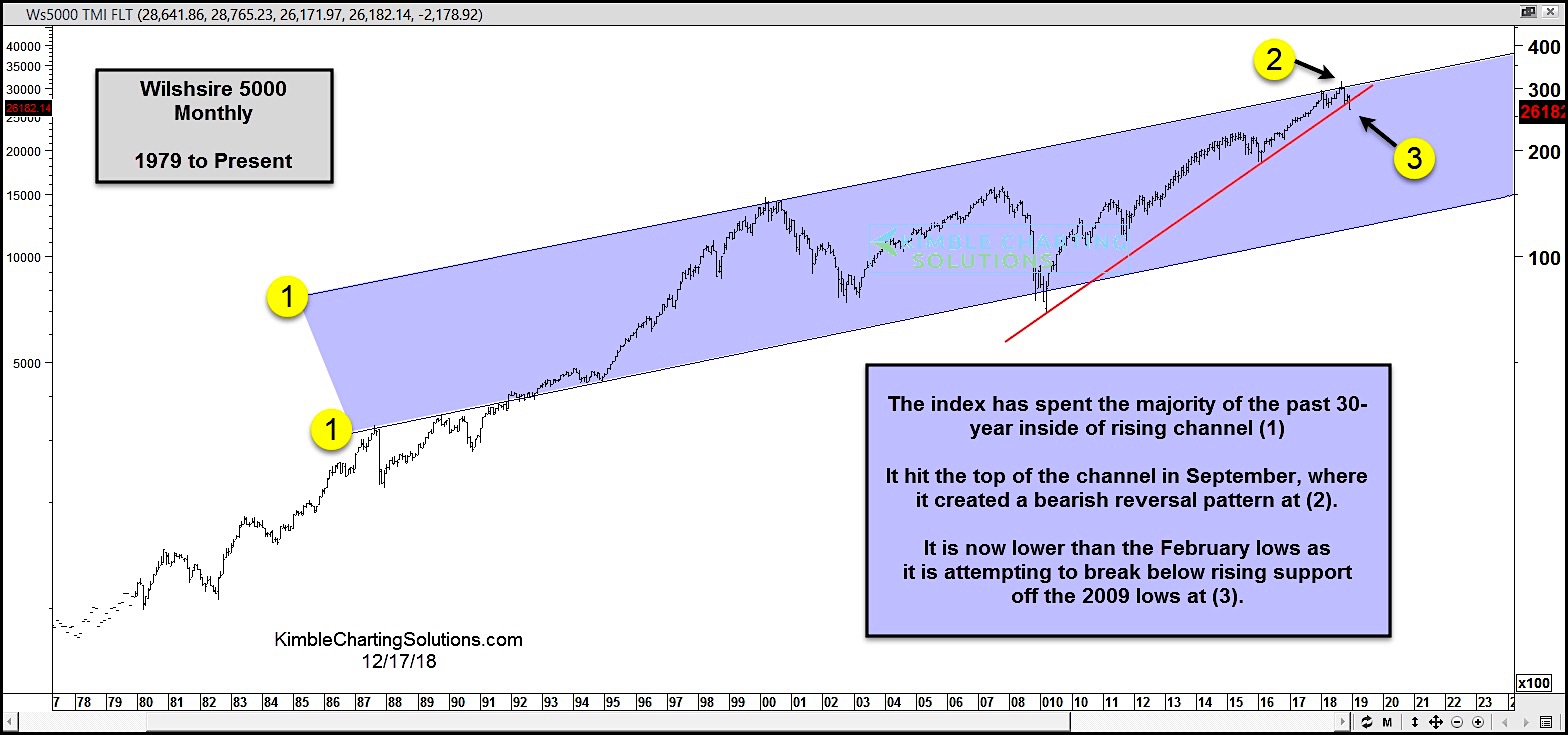
For the past 30 years, the Wilshire 5000 has traded within a very broad channel (1).
In September, the index hit the top of the channel and reversed lower (2). This price action created a bearish monthly reversal pattern, triggering caution.
It is currently making new 2018 lows (below the February lows) while breaking down through important trend line support off the 2009 lows (3).
This comes after creating a bearish monthly reversal pattern off the top of the long-term channel. Careful out there.
Wilshire 5000 Monthly Chart
Note that KimbleCharting is offering a 2 week Free trial to See It Market readers. Just send me an email to services@kimblechartingsolutions.com for details to get set up.
Twitter: @KimbleCharting
Any opinions expressed herein are solely those of the author, and do not in any way represent the views or opinions of any other person or entity.


: Showing Some Signs of Emerging Strength")
