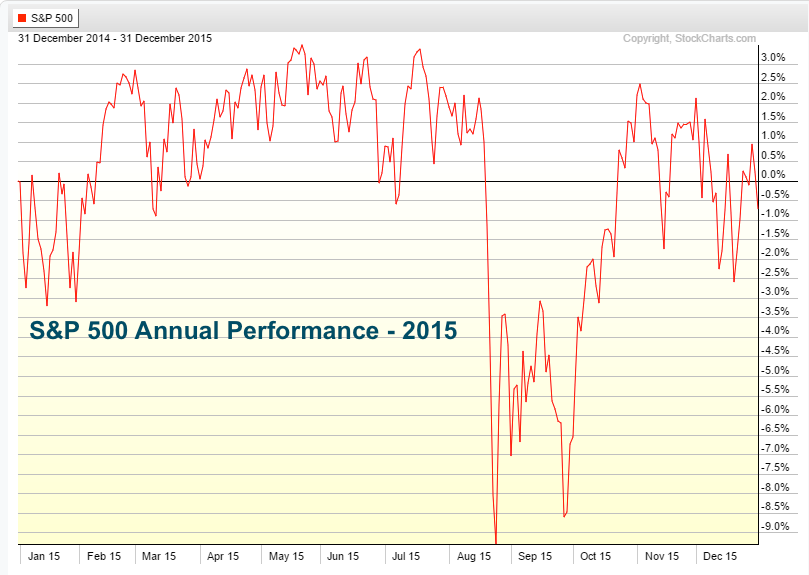
This past year was a rough year for many traders, as the market chopped around for the majority of the year. For 2015, the S&P 500 Index closed down -0.73 percent not including dividends.
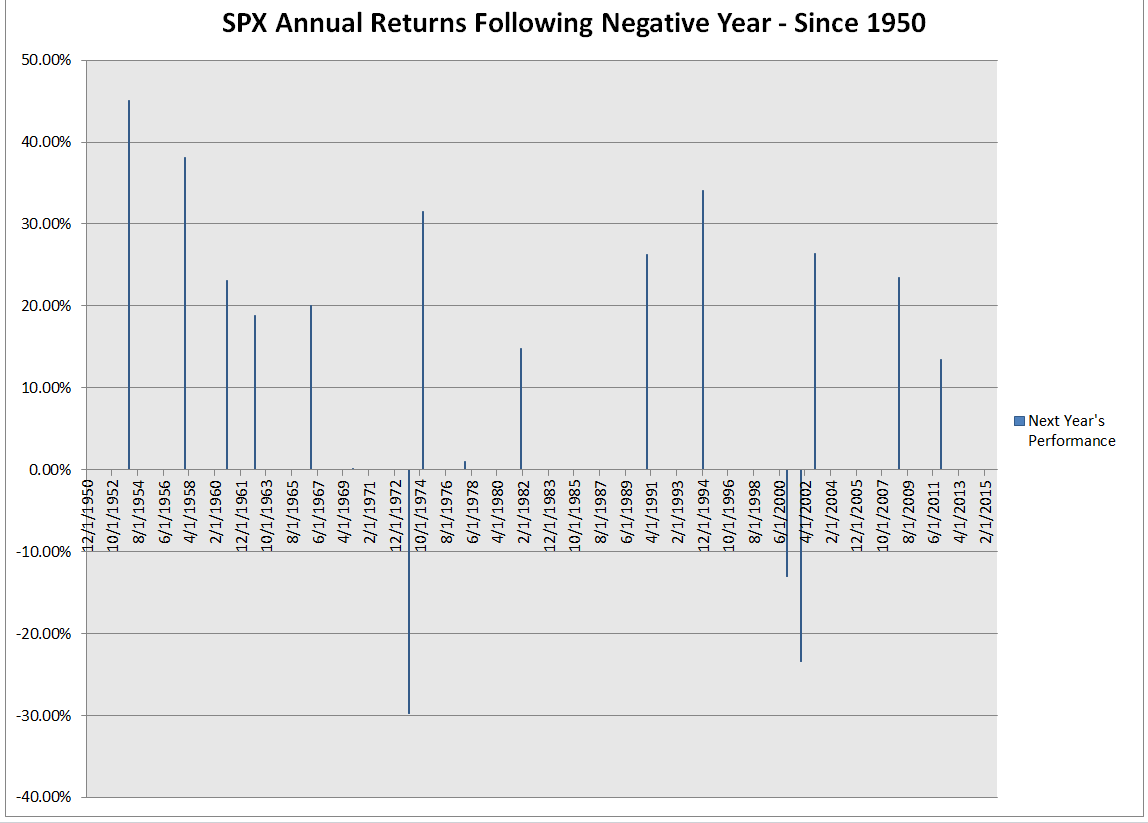
Prior to 2015’s down year, there had been 17 negative years in the S&P 500 since 1950; 11 since 1970; and 7 since 1990. The most recent year the S&P 500 closed down for the year was 2011 when the index closed down only marginally by -0.003 percent (i.e., technically negative but essentially flat). The S&P 500’s performance the following year in 2012 was 13.41 percent.
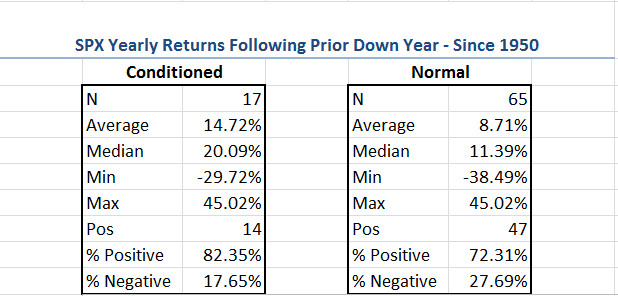
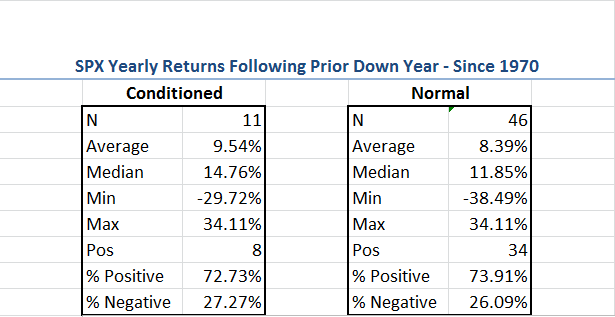
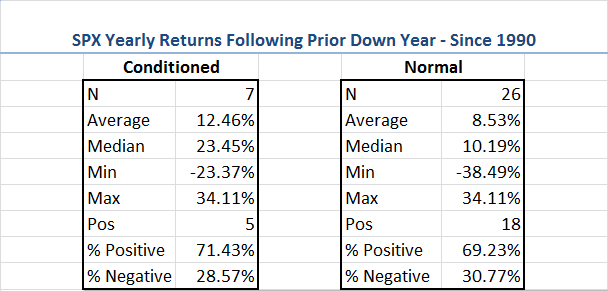
I decided to expand on this idea a bit by running a simple study in Excel to look at what happens, on average, the following year when the S&P 500 (SPX) closes down for the year. You can see the results below. Notice that the “conditioned” data is based on the returns in the years following a negative year, while the “normal” data includes all the trading days; making this comparison allows you to see if whether or not there is a historical tendency for outperformance/underpformance based on this one factor – a negative year.
What I find interesting from the results below is that the average and median returns are higher after a down year, with the maximum drawdown (min) being lower as well. This is true since 1950, 1970, and 1990.
So what does this data imply, if anything, for the S&P 500 in 2016?
Well, history clearly suggests that the S&P 500 should outperform this year. Does that mean we are guaranteed to see double-digit returns? Of course not, nothing is absolute. As you can see in the chart below, negative years in 1973, 2000, and 2001 were followed by another negative year. Still, since 1950, when the S&P 500 closed down for the year, the following year closed positive 82.35 percent of the time (see below).
There is still plenty of time left in 2016. No one knows what will happen for sure. However, there is no denying there is a historical tendency for outperformance in the S&P 500 following a down year.
Let’s check back in another year and see how things play out. Thanks for reading.
Twitter: @MarketPicker
Any opinions expressed herein are solely those of the author, and do not in any way represent the views or opinions of any other person or entity.
 Rolling Over At Key Fibonacci Level?")


