Jerome Powell brought reality to the market.
“The latest economic data have come in stronger than expected, which suggests that the ultimate level of interest rates is likely to be higher than previously anticipated,” Powell told the Senate Banking Committee in prepared remarks.
“If the totality of the data were to indicate that faster tightening is warranted, we would be prepared to increase the pace of rate hikes.”
Powell noted that economic data from January on inflation, job growth, consumer spending, andmanufacturing production have partly reversed course from the slowdown seen back in December.
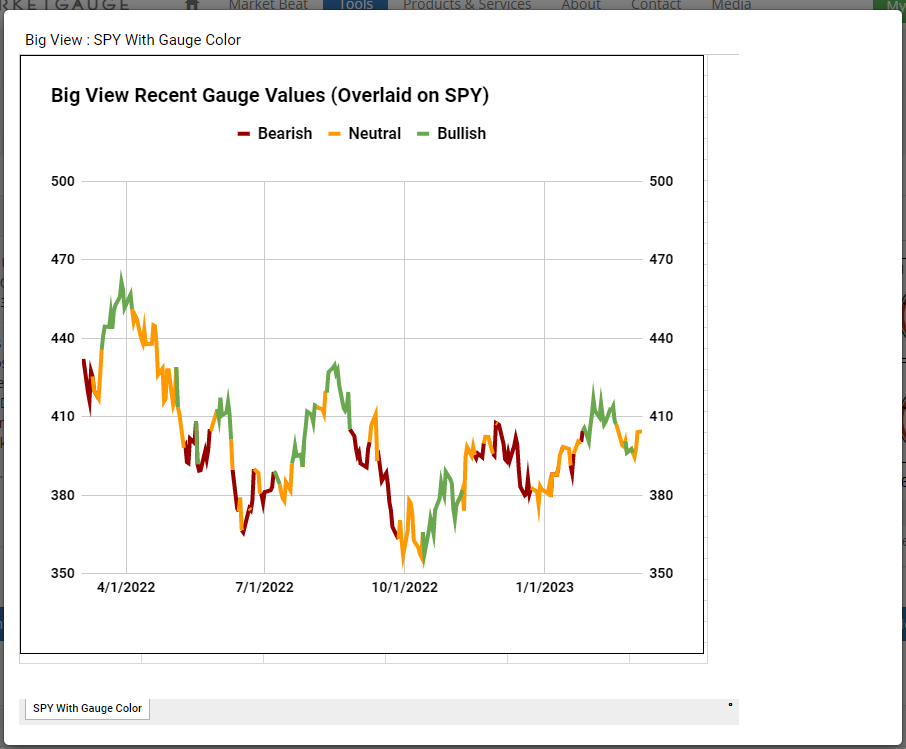
Interestingly, coming into today, the Sentiment Gauge flashed neutral.
Monday’s daily stated that “Looking at Granny Retail, that business cycle not only leaves investors with the trading range resistance, it also shows how the Retail sector could be a harbinger of worse times this spring.”
We went on to say, “Granny Retail and Prodigal Regional Banks are my key go-to’s for this week.”
So, will neutral sentiment go to bearish? And if so, what is next?
Powell says he has no intention of raising the inflation target from 2%-but that could change-especially since CPI is still above 6% and that number comes out next week.
With an inverted yield curve, a potential bottom in the long bonds, a stronger dollar, a persistent trading range and-certain commodities still strong regardless (sugar, grains, crude oil, steel), the environment keeps screaming stagflation.
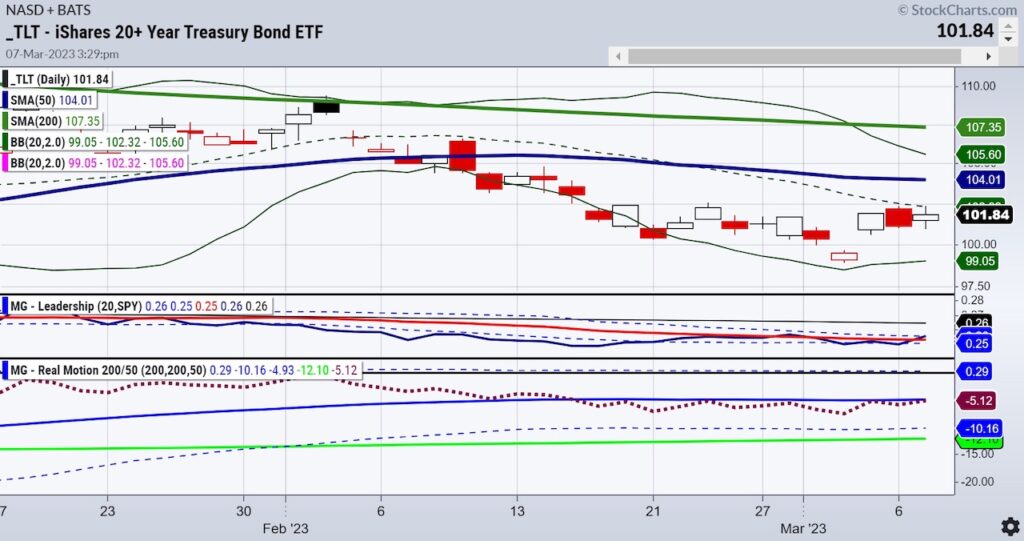
The chart of the long bonds (TLT) has a constructive exhaustion gap bottom in play. Since then, we have seen consolidation between 101-102.50. TLT is now outperforming SPY (Leadership).
And, the Real Motion indicator shows a positive divergence as momentum is just under the 50-DMA while price is considerably below its 50-DMA.
Why would long bonds bottom? The long bond is just one part of the yield curve. It could mean that while the short-term yields invert, the market is expecting a recession, hence a flight to safety in long bonds.
We imagine that should 20+ year bonds continue to go north, that too can be inflationary.
TLT has to get above the 50-DMA to get interesting.
Stagflation is Worst thing for the FED.
Pause-inflation goes higher.
Don’t pause-certain inflation beyond Fed’s control goes higher-given geopolitical and natural disaster potentials.
Raise rates higher and kill the economy.
Stock Market ETFs Trading Analysis & Summary:
S&P 500 (SPY) 390 support with 405 pivotal 410 resistance
Russell 2000 (IWM) 190 failed so Grandpa hurts-185 support
Dow (DIA) 326 support 335 resistance
Nasdaq (QQQ) 284 big support 300 pivotal 305 resistance
Regional banks (KRE) 57 big support 60 resistance
Semiconductors (SMH) 240 pivotal 248 key resistance
Transportation (IYT) 240 resistance and 230 support
Biotechnology (IBB) 125-135 trading range
Retail (XRT) 66 pivotal with 64 key support
Twitter: @marketminute
The author may have a position in mentioned securities at the time of publication. Any opinions expressed herein are solely those of the author and do not represent the views or opinions of any other person or entity.

 Rolling Over At Key Fibonacci Level?")


 Rolling Over At Key Fibonacci Level?")