The economic recovery and ensuing bull market off the 2009 financial crisis lows has been one of the longest in history.
And over that stretch of time, the S&P 500 Index has reached technical milestones.
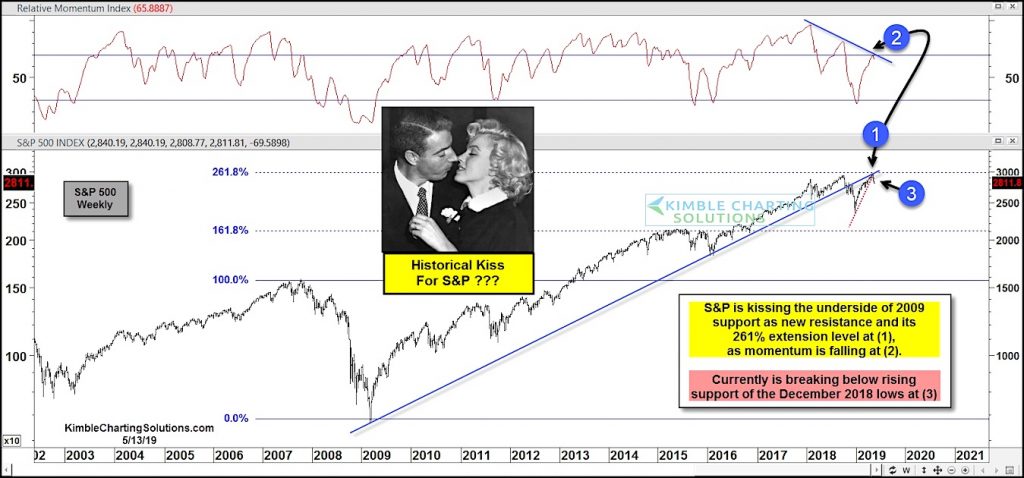
While making new all-time highs, the index rallied past big round numbers like 2000 and 2500, and Fibonacci extension 161.8 before reaching its Fibonacci 261.8.
In the process of reaching the 261.8 Fibonacci extension, the S&P 500 saw its momentum slow and the S&P 500 broke its long-term up trend line (1).
Over the past 18 months, the index has carved out 3 peaks (of sorts). And, in doing so, momentum has produced a lower high at each (2).
The latest peak comes at a “kiss” of the underside of that long-term up trend line. And the recent selloff has the S&P 500 breaking below its short-term rising up trend line off the December 2018 lows.
This isn’t a good look for the market.
Stock market bulls do not want to see selling accelerate here.
S&P 500 Index – Bearish Kiss of Resistance?
Note that KimbleCharting is offering a 2 week Free trial to See It Market readers. Just send me an email to services@kimblechartingsolutions.com for details to get set up.
Twitter: @KimbleCharting
Any opinions expressed herein are solely those of the author, and do not in any way represent the views or opinions of any other person or entity.


