RARE AND RAPID DROP IN ISM MANUFACTURING
ISM Manufacturing PMI Index came in well below expectations on October 1, 2019 sparking renewed fear of a recession.
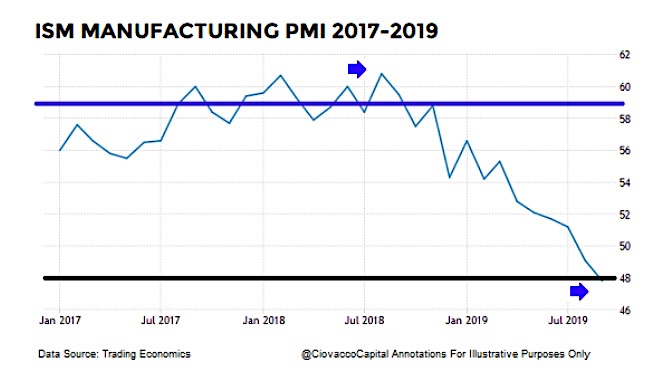
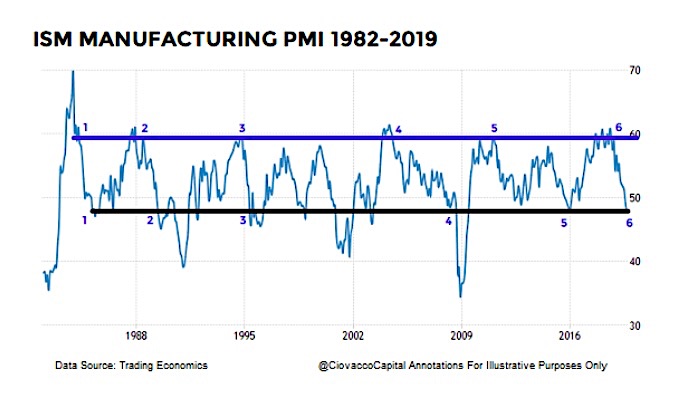
Given the ISM Manufacturing Index was strong in August 2018 and plunged rapidly to the October 1, 2019 level, it might be helpful to know how many similar drops from above the blue line to below the black line have occurred since 1982.
And how did the S&P 500 Index and broader stock market perform over the next five years?
The answer to the first question is five previous times (see chart below).
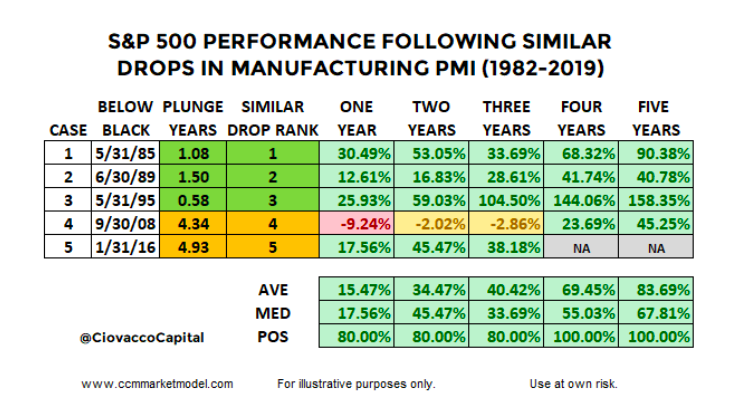
The answer to the question how did the stock market perform over the next five years is “quite well”. In the first two years, 80% of the cases posted positive returns. All historical cases (1982-2019) posted gains after four and five years.
In the present day case, it took 1.08 years for ISM Manufacturing PMI to drop from the peak above the blue line to below the black line.
As you can see in the table above, the three most similar “rapid drops in ISM Manufacturing PMI” cases were 1985, 1989, and 1995. The 2008 and 2016 cases required over four years to see a similar drop to what just occurred in a little over a year.
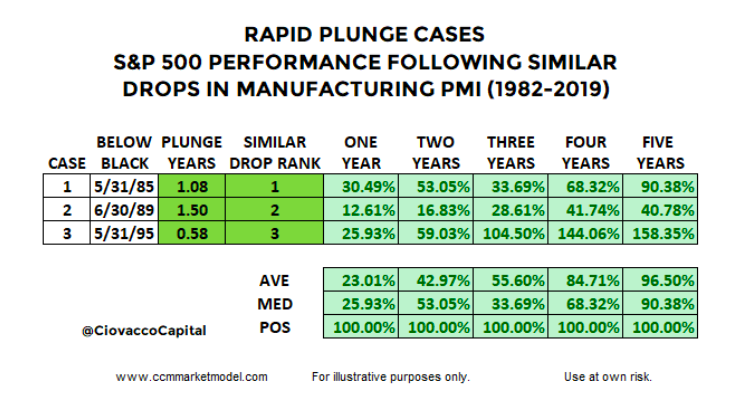
If we isolate the similar “rapid plunge” cases, historical performance was more satisfying.
The present day case has many unique circumstances and will follow a unique path. This study simply provides some additional historical context. The bearish case for a rapid plunge in manufacturing data is easy to understand and will get plenty of coverage. These studies, based on history, tell us to keep an open mind about all outcomes from wildly bearish to wildly bullish.
EXPANDED COVERAGE IN THIS WEEK’S VIDEO
This week’s CCM video will most likely provide additional context regarding the similar historical periods shown above. CCM’s weekly video is released every Friday evening between 6 pm ET and midnight. Weekly videos can be found via CCM’s Twitter Feed, CCM’s Blog Short Takes, or the Ciovacco Capital Channel.
BUT 2019 IS SIGNIFICANTLY DIFFERENT
You can make that argument about 100% of the historical studies performed about the economy and financial markets. No two periods in human and market history have the exact same combination of fundamentals, technicals, valuations, interest rates, inflation, etc. Today is always different; that is a constant in the markets.
WHAT ABOUT SMALL SAMPLE SIZES?
The limited sample size of the similar cases above is what it is. We cannot control sample sizes. There have only been three 40%-plus declines in the S&P 500 since 1950 (1973-74, 2000-2002, and 2007-2009), which also represents a very small sample size. Are we supposed to totally ignore these major declines because of the small sample size? According to Reuters, the S&P 500 was officially launched on March 4, 1957, meaning any S&P 500 study deals with a very limited historical data set. It is what it is.
When we study rare events, we acknowledge the sample size and try to learn anything that can add value in the present day. The same concepts apply to the studies above. There are countless economic and market studies that are based on small sample sizes.
Typically, the small sample size argument is only raised when the results run counter to someone’s personal opinion. When results agree with someone’s personal view, the small sample size is suddenly not a problem. If you believe a study or data set is irrelevant, there is an easy solution – ignore it.
Twitter: @CiovaccoCapital
The author or his clients may hold positions in mentioned securities at the time of publication. Any opinions expressed herein are solely those of the author, and do not in any way represent the views or opinions of any other person or entity.


