Since the Nasdaq Composite closed over 5000 last Monday, it’s been in a quiet pullback – dropping a little over 2 percent from high to low. The good news is that this week should offer up some clues for traders eager to decipher the extent of the Nasdaq pullback.
There’s been a lot of buzz around Nasdaq 5000 and its return to the “bubble” highs set 15 years ago this March. Last week, I wrote a macro piece on the Nasdaq, pointing out some key differences in the the fundamental and technical terrain of 2000 vs 2015. I also cautioned that “big” macro levels (+/- a few percent) can take time to chew through and that sentiment was running a bit hot near-term.
Last Monday, I tweeted out a quick stat for some perspective:
The Nasdaq hitting the 5000 mark is a well-earned celebration. But it’s up almost 900 pts off the Oct low (4116.60). That’s 21.7% in 4+ mos.
— Andy Nyquist (@andrewnyquist) March 3, 2015
That wasn’t tweeted in a vacuum, as some short-term indicators were saying that a pullback or consolidation was coming. But it’s also not decidedly bearish, because stats like that also are common to what investors see in a bull market.
When stocks are in a bull market, it’s easier to trade within the trend. That means that it’s a good idea to monitor (and trade into) support levels that offer good risk-reward. Support levels give us an approximation of where to set our stops (so traders know exactly what’s at stake). This defines risk and keeps losses small. On the flip side, if one wants to short, they might look to do so at the top of a “time-frame” defined channel or into an important resistance level or on the break of a key support level (always keeping risk defined with a focus on your time frame). Full disclosure: I took a small trading “scalp” in QID recently and have a small position remaining.
Although I cover several indicators (technical and fundamental), ultimately I enter (and define) my trades by price. So I think it’s probably best to look at a couple charts of the tech sector and point out some things I’m watching within the current Nasdaq pullback.
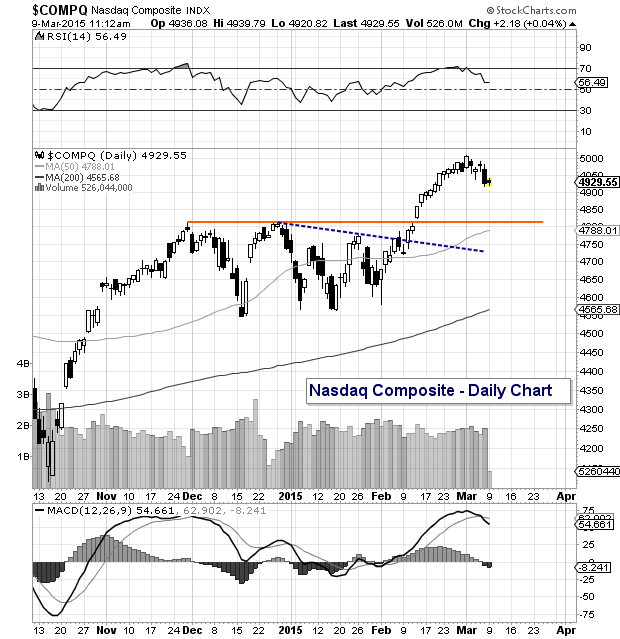
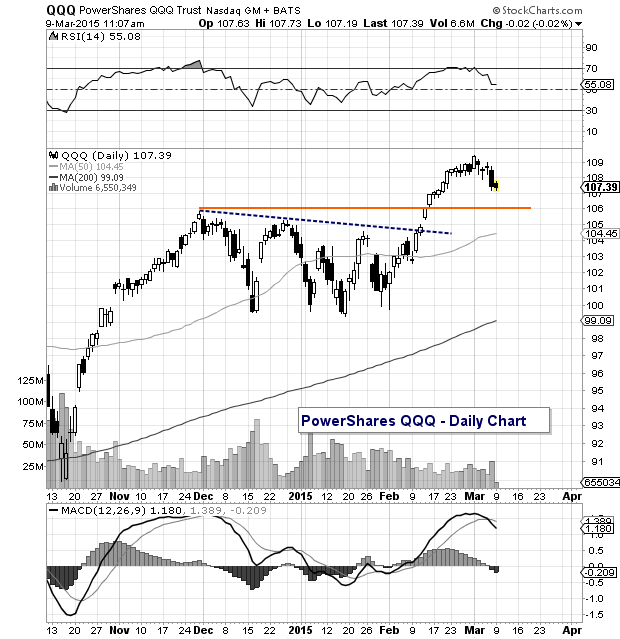
Below are 2 charts that look at the tech sector from a broad, yet near-term, perspective. The first is of the Nasdaq Composite and the second is of the Nasdaq 100 ETF, the PowerShares QQQ Trust (QQQ – stock quote)… the latter for ETF traders. Both are similar in structure, so we will focus on the Nasdaq Composite.
As you can see, there was a breakout in the tech sector over the 4750 level (and confirmed over 4800) that lead to the move up over 5000. The recent pullback isn’t uncommon as breakouts often see a retest. This “test” allows trader and investors how momentous the move is. With this in mind, bullish traders can define risk into a few near-term levels. 4845 represents the .382 Fibonacci retracement of the Feb low to March high. Just below that resides the breakout levels of 4800 and 4750 (note the 50 day moving average is currently at 4788).
If the Nasdaq pullback ended today, or near the bottom of this range at 4750, it would still be within the garden variety of 2-5 percent pullbacks we’ve seen many times over the past two years. But a move that slices below this level would signal caution and the possibility of filling open gaps at 4726 and 4676 and 4547 (note that 4547 also marks the December lows). The last rung of near-term support resides at the December lows. Note that over the past year, we’ve seen two 10 percent corrections.
Nasdaq Composite Daily Chart – A look at the Nasdaq pullback
PowerShares QQQ Trust Daily Chart
So there are a few levels to be aware of over the coming days. The setup is bullish until proven otherwise. But since we all have different time frames and risk profiles, it’s up to you to make your plan and define your risk accordingly.
You can also read my companion post on the near-term outlook for the S&P 500. Thanks for reading.
Follow Andy on Twitter: @andrewnyquist
Author has a trading position in QID at the time of publication. Any opinions expressed herein are solely those of the author, and do not in any way represent the views or opinions of any other person or entity.

: Showing Some Signs of Emerging Strength")
