Last year was so much fun that investors thought they’d start out 2015 the same way… with hopes of getting the same result into Spring. To recap: Start the year with a really crappy January, and follow it up with an awesome February. And that has given way to thoughts of positive seasonality into May. Will it really be that easy?
To a certain extent, active investors shouldn’t fight that type of setup. It’s always easier trading (swimming) with the trend. BUT it’s our job not to get complacent. So I tweeted some thoughts about the stock market’s runup following another record close for the S&P 500 (SPX) on March 2nd.
The S&P 500 is about 2% off my “highest” near-term target (2163) and within 1% of its major 1.618 Fib extension off the ’09 lows (2138). — Andy Nyquist (@andrewnyquist) March 3, 2015
The Nasdaq hitting the 5000 mark is a well-earned celebration. But it’s up almost 900 pts off the Oct low (4116.60). That’s 21.7% in 4+ mos. — Andy Nyquist (@andrewnyquist) March 3, 2015
As well, since end of January the $VIX has dropped from 20.97 to 13.04. Sentiment numbers look a bit juicy & mid-end March seasonality weak. — Andy Nyquist (@andrewnyquist) March 3, 2015
And lastly the $DAX is up over 3000 pts off its October lows (8354.97). That’s 36.6% in 4+ mos. It’s outperf of the S&P 500 is far & wide. — Andy Nyquist (@andrewnyquist) March 3, 2015
So my trading lens isn’t seeing a good risk-reward setup on a macro level (over the near-term). But trust me, I’ll be trading… nimbly;) — Andy Nyquist (@andrewnyquist) March 3, 2015
The tweets were less about calling a tradable “top” than simply pointing out that my near-term indicators were telling me to be nimble and and to pick my spots carefully. In short, markets had moved too quickly and sentiment was ticking higher – AAII percent bulls ticked higher into late February and the NAAIM Exposure Index hit 99 on 2/25 and 92 on 3/4. In short, my very near-term risk-reward was skewed to the downside and a stock market pullback seemed in line.
And that’s exactly what we’ve seen. Since last Monday’s record close, the S&P 500 is down 2.2%. That’s not much in the scheme of things, but when trading major ETFs, e-mini contracts, options, or individual stocks (higher beta), it’s important to our P&L.
So what am I looking at now?
Well, it’s pretty much all “technical” this week. The pullback has now fallen into the typical 2 to 5 percent garden variety range for the bull market, so a reversal wouldn’t be unexpected this week. But we need to make the market prove itself.
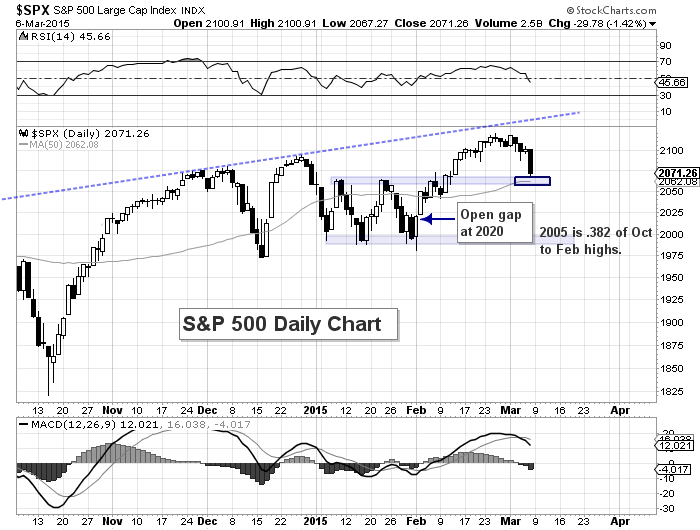
A convergence of key support levels come into play on the S&P 500 around 2062/2066. That level is marks the January to early February range tops, the 50 day moving average, and the .382 Fibonacci retracement of the Feb 2 low to Feb 25 high. If the markets breach that level in a meaningful way, we could dip down to fill the February 3 open gap at 2020, or even retrace down to 2000 level (2005 marks the .382 Fibonacci retracement of the October lows to February highs.
As I’ve written about multiple times, there’ still a few overhead targets to be aware of: The biggest one is at 2138, the 1.618 Fibonacci extension from the 2009 lows back above the 2007 top. The other two are near-term fibonacci levels: 2124 (1.272) and 2163 (1.618).
S&P 500 Daily Chart – Support levels to watch for the week of March 9th
Have a good week and thanks for reading.
Follow Andy on Twitter: @andrewnyquist
No position in any of the mentioned securities at the time of publication. Any opinions expressed herein are solely those of the author, and do not in any way represent the views or opinions of any other person or entity.


