JP Morgan (JPM) “weekly” Stock Chart
The banks have been lagging the broader market in 2020 (and during the coronavirus pandemic) and it’s showing up once again this week.
It goes without saying that the banks are an important sector to watch. One word: the economy.
Today’s chart looks at well-known banking leader JP Morgan NYSE: JPM.
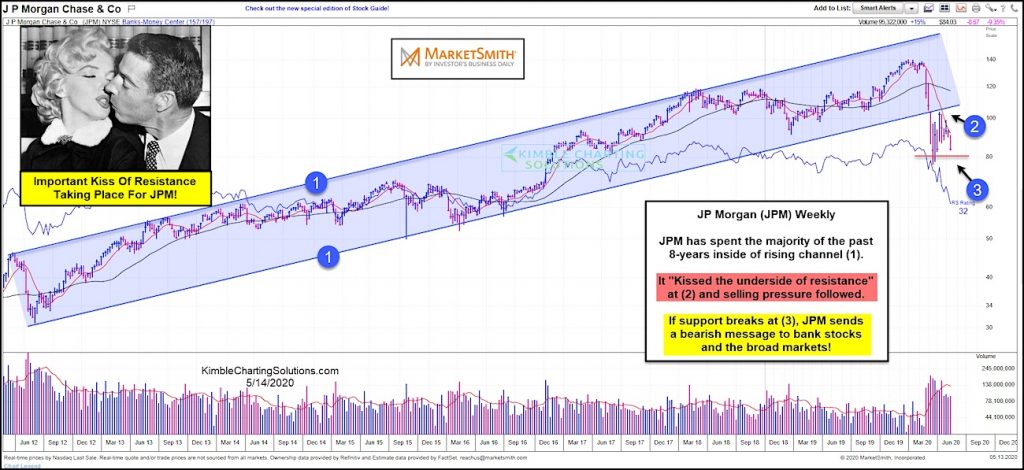
As you can see, JP Morgan (JPM) spent the better part of the past 8 years in a well-defined rising price channel at each (1). However, this year’s bear market hit JPM hard, sending its stock price below channel support in a waterfall type decline.
The recent recovery rally saw JPM “kiss” the underside of its old rising price channel at (2) and reverse lower.
This reversal lead to another bout of selling this week. And if JPM doesn’t hold support at (3), it will send a bearish message to the banking sector and broader stock market. Stay tuned!
Note that KimbleCharting is offering a 2 week Free trial to See It Market readers. Just send me an email to services@kimblechartingsolutions.com for details to get set up.
Twitter: @KimbleCharting
Any opinions expressed herein are solely those of the author, and do not in any way represent the views or opinions of any other person or entity.


 Trading Into Inflection Point")