While inflation continues to dominate the news headlines (and consumer concerns), I think its important to highlight an interesting development in the commodities complex.
And a potentially positive development!
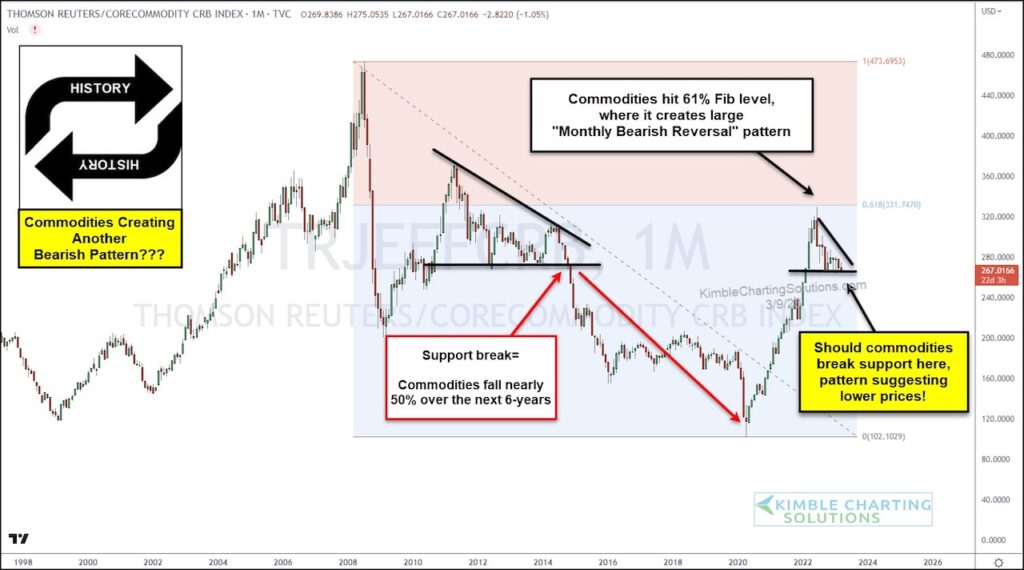
Today we take a look at a long-term “monthly” chart of the CRB Commodity Index.
As you can see, this key Commodity Index peaked at its 61.8% Fibonacci level last year before reversing lower. This produced a “monthly bearish reversal” pattern. And the subsequent price action produced a bearish wedge pattern.
The pattern is now testing critical price support. Note that a similar pattern (at similar price support) produced a 50% decline from 2014 to 2020!
So even though inflation seems to be in the headlines, commodities could be creating another bearish pattern that leads to lower prices… that would take the edge off inflation worries. Stay tuned!
Thomson Reuters Commodity Index CRB “monthly” Chart
Note that KimbleCharting is offering a 2 week Free trial to See It Market readers. Just send me an email to services@kimblechartingsolutions.com for details to get set up.
Twitter: @KimbleCharting
Any opinions expressed herein are solely those of the author, and do not in any way represent the views or opinions of any other person or entity.

: Worrisome to Broader Market?")
