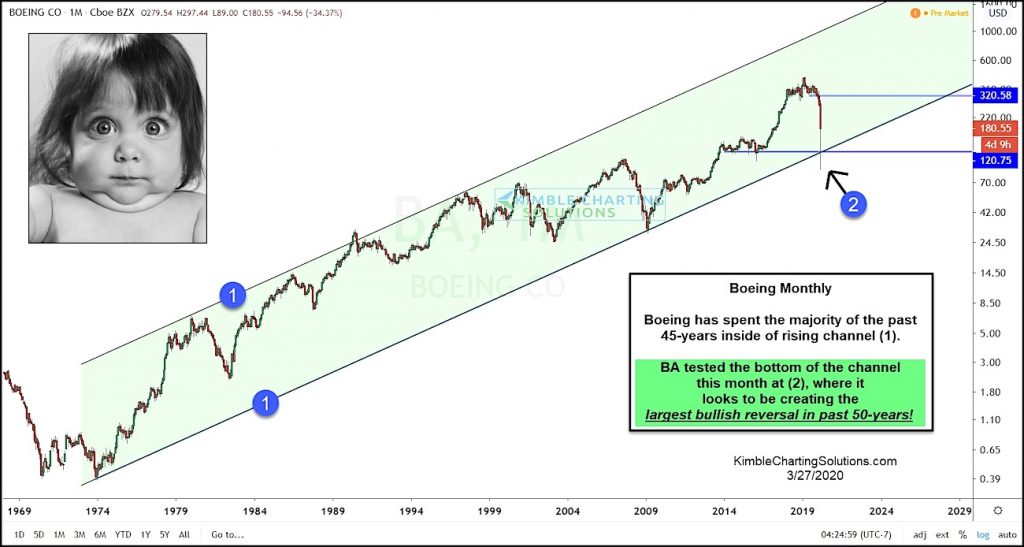
Just last week we looked at Boeing (BA), highlighting it’s 45 year rising trend channel.
At the time, the Boeing’s stock price was nearing a test of the lower trend line. And within hours, Boeing had broken through the trend line with force (falling as low as 89.07).
Super bearish, right? Well, the jury is out on that after the stock (and broader market) embarked on a monster 3-day bear market rally.
As you can see in today’s chart update, it appears to be the largest bullish reversal for Boeing in 50-years!
The jury is still out because there’s still 2 days left in the month for this candle to change… and in this environment, 2 days seems like an eternity.
Stay tuned!
$BA Boeing “monthly” Stock Chart
Note that KimbleCharting is offering a 2 week Free trial to See It Market readers. Just send me an email to services@kimblechartingsolutions.com for details to get set up.
Twitter: @KimbleCharting
Any opinions expressed herein are solely those of the author, and do not in any way represent the views or opinions of any other person or entity.

 Rolling Over At Key Fibonacci Level?")


