It has been a tough year to pick winning stocks, and with more uncertainty ahead, now is not the time to be heavily invested in tech and big names that have broken down in price over the recent months.
Currently, oil and energy-related plays have been outperforming, and with that, alternative energy plays have also shown interesting chart setups.
Therefore, let’s look at two symbols involved within this space that have recently perked up.
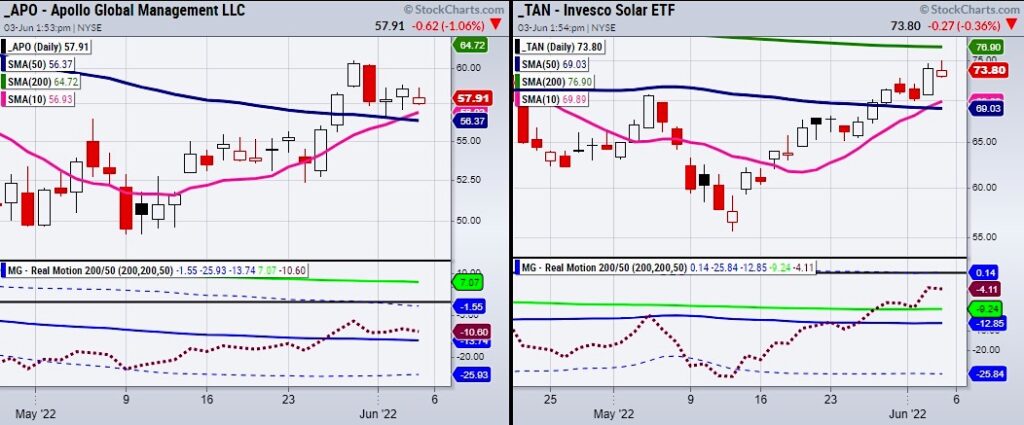
Apollo Global Management (APO) has heavy ties in the wind space and has also recently cleared its 50-Day moving average at $56.37. Since APO has been trending lower and only recently begun to make higher lows if it holds its major moving average this has the potential to run towards its next main resistance area around $65.
Each chart is also equipped with our Real Motion momentum indicator, which can help show if a symbol is outperforming, underperforming, or staying neutral.
In the case of APO, Real Motion (RM) is currently neutral since it is sitting roughly around the same area it is in price.
Both price and RM are above the 50-DMA and below the 200-DMA. However, the solar ETF (TAN) is outperforming in RM as seen in the above chart.
Notice how RM has cleared over its 200-DMA (green line) while the price has yet to clear its 200-DMA at 76.90. Though the 200-DMA is a key resistance area, TAN is worth watching for a trade setup if momentum and price continue with an upward trend.
The reason for keeping track of energy-related companies and ETFs is that this space can act as a potential safety play in a volatile market environment while other companies such as big tech are more susceptible to market breakdowns.
Overall, we are looking for symbols that can buck the normal trend and outperform.
Watch Mish’s latest appearance on Fox Business and BNN Bloomberg!
Stock Market ETFs Trading Summary:
S&P 500 (SPY) 407 area needs to hold from the 10-DMA. 423.90 50-DMA to clear.
Russell 2000 (IWM) 181.77 area to hold.
Dow Jones Industrials (DIA) 325 support area.
Nasdaq (QQQ) 309 level needs to hold as support.
KRE (Regional Banks) Needs to clear 65
SMH (Semiconductors) 237 support area. Flirting with the 50-DMA at 242.96
IYT (Transportation) Inside day. 228.70 minor support area.
IBB (Biotechnology) Flirting with the 10-DMA at 116.17
XRT (Retail) Inside day. 64 to hold.
Twitter: @marketminute
The author may have a position in mentioned securities at the time of publication. Any opinions expressed herein are solely those of the author and do not represent the views or opinions of any other person or entity.


