The week started with a large rally and is now ending with the Nasdaq 100 (QQQ) and the S&P 500 (SPY) at all-time highs.
Though the Dow Jones Industrial Average (DIA) is not far behind, the small-cap index Russell 2000 (IWM) struggles in the middle of its trading range.
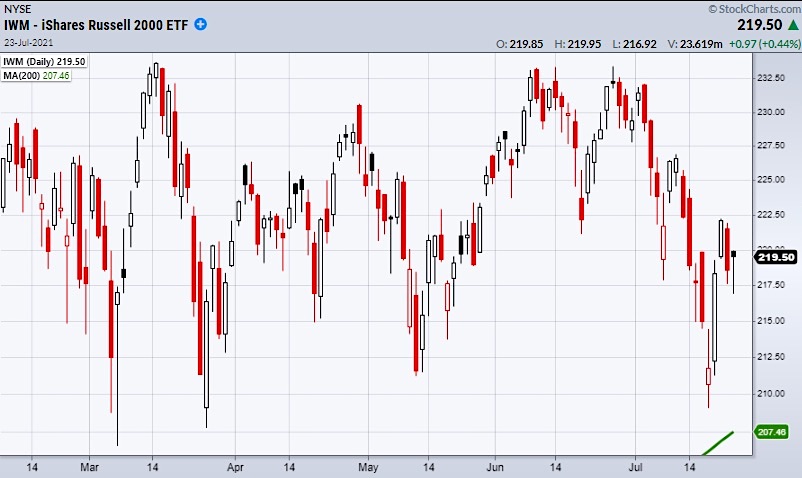
The above etf chart shows how the Russell 2000 (IWM) has been stuck within a trading range for the past 6 months. Unable to break to new highs $IWM has had many weeks of choppy price action.
Though we should continue to watch for strength in the major stock market indices, we should also be hesitant if $IWM continues to flounder within the middle of its range.
Right now, the Russell 2000 needs to play catchup, and if that doesn’t happen it could show a disconnect in the market signaling potential choppy price action is head.
Another space we keep our eyes on is the transportation sector ETF (IYT).
With the rise in covid cases, supply chain disruptions continue to throttle trade across the world. That is where $IYT helps us gauge how the movement of goods could affect the market.
With that said, the recent rally has brought $IYT back over its 10-Day moving average at $255.53 and back into the prior week’s trading range.
Along with $IWM, it will need to hold its recent price area.
Over $251.78 for $IYT and over $216.91 for $IWM.
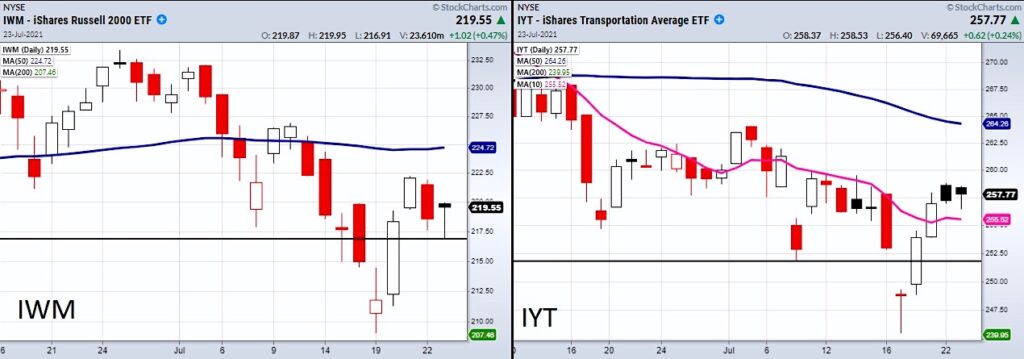
These price levels should act at minor support levels throughout the next week.
The current price action leads us to believe the market is ready for another push higher, however, stay cautious if IWM and IYT break these key price levels.
As a continuation of last week’s video, Mish talks about consumer staples and consumer discretionary by following up on some stocks she presented last week, as well as offering some new choices.
Consumer’s Appetite – What are Stocks Saying?
Stock Market ETFs Trading Analysis & Summary:
S&P 500 (SPY) New all-time highs.
Russell 2000 (IWM) Like this to hold over 216.91.
Dow Jones Industrials (DIA) 351.09 resistance.
Nasdaq (QQQ) New highs.
KRE (Regional Banks) Holding downward trend. Needs to break the 10-DMA at 62.52 for 2 consecutive days.
SMH (Semiconductors) Watch this to clear and hold over 258.60.
IYT (Transportation) Minor support the 10-DMA at 255.52.
IBB (Biotechnology) Needs to hold over 165.79.
XRT (Retail) 94.70 support the 50-DMA.
Twitter: @marketminute
The author may have a position in mentioned securities at the time of publication. Any opinions expressed herein are solely those of the author and do not represent the views or opinions of any other person or entity.

: Showing Some Signs of Emerging Strength")
