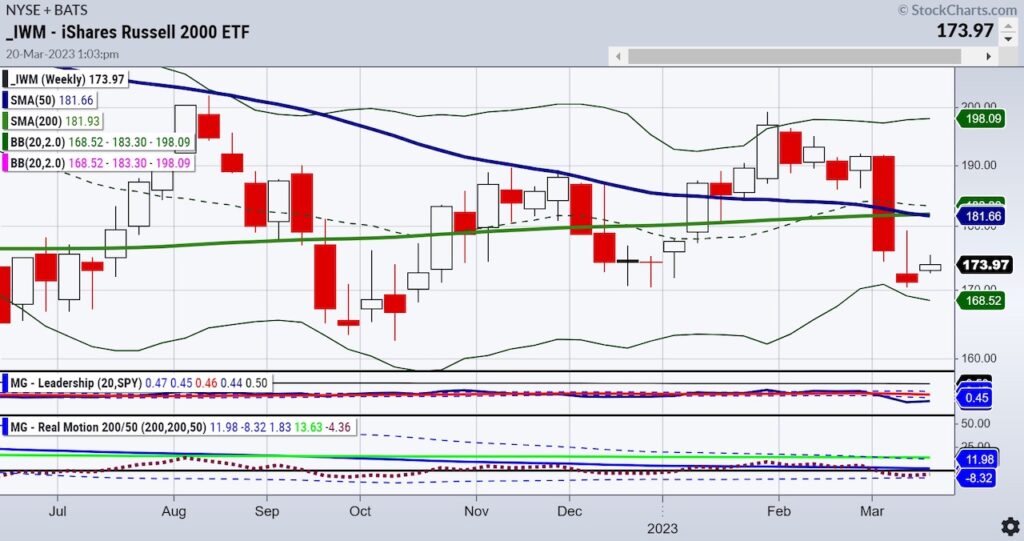
Is it here in the Russell 2000 (IWM)?
Check out the weekly chart below.
The 50-week moving average just crossed below the 200-week moving average. That is bearish.
And the Leadership Indicators shows IWM well underperforming the S&P 500 (SPY). Bearish.
The Real Motion Momentum Indicator has moment in a bearish phase as well, albeit with some signs of oversold conditions.
This weekend’s Outlook pointed out that “There are far too many disjointed economic scenarios playing out. These are all meaningful problems that could have a serious impact on the financial condition of the U.S.”
Our Risk Gauges are Risk-Off for the most part.
Even with Monday’s rally, sectors like Retail (XRT) and Transportation (IYT) are weak.
So where is the joy?
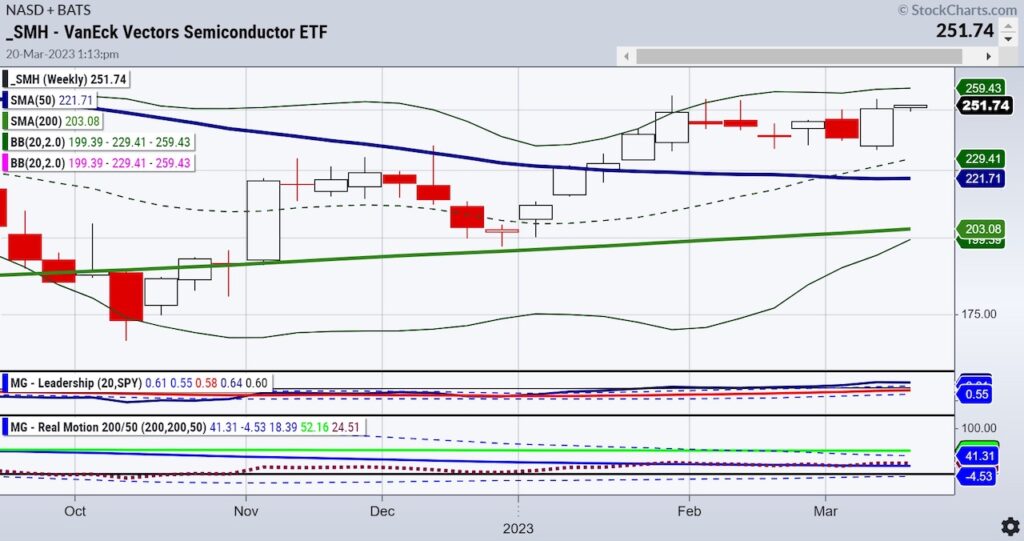
Our Sister Semiconductors is the bright spot.
Opposite of her Granddad, the Russell 2000 (IWM), she is in a weekly bullish phase.
SMH outperforms the SPY.
One caveat-the Real Motion momentum indicator is in a bearish phase with momentum just skimming along the 50-WMA. Keep that in mind.
Add our Big View Indicator and it says:
Risk-On
- Value stocks (VTV) have gotten crushed last week when compared to Growth stocks (VUG) on a relative basis. VUG has reclaimed a bullish phase similar to the Nasdaq, while VTV is now underperforming relative to the rest of the US Market. (+)
Neutral
- US Indices are showing a confused picture, with QQQ reclaiming a bullish phase on both a daily and weekly timeframe. In contrast, the other 3 key indices continued to sell off and close under their 200-day moving averages and in Distribution phases. (=)
What happens next?
Perhaps SMH is telling us that whilst IWM holds the December lows, the market can still rally.
Or perhaps, “tech saves the day” trade, whilst still the future, got a bit too ahead of itself and the FOMC can bring everything tumbling down.
Everything except inflation. We still believe that will persist.
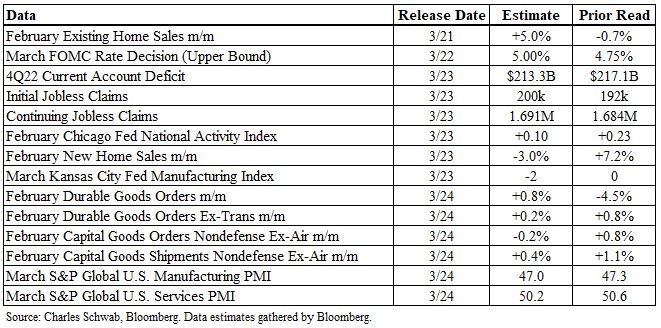
Here is a look at this week’s economic data on tap.
Stock Market ETFs Trading Analysis & Summary:
S&P 500 (SPY) 390 pivotal
Russell 2000 (IWM) Still weak comparatively-170-180 range now
Dow (DIA) 310 support 324 resistance
Nasdaq (QQQ) 328 is the 23-month MA resistance-300 support
Regional banks (KRE) 44 support 50 resistance-still looks like lower in store
Semiconductors (SMH) 255.64 last month’s high. 248 nearest support
Transportation (IYT) Clutch hold 218 if this market is to hold
Biotechnology (IBB) 2 inside days and at resistance-interesting sector
Retail (XRT) 60 big support and 64 big resistance
Twitter: @marketminute
The author may have a position in mentioned securities at the time of publication. Any opinions expressed herein are solely those of the author and do not represent the views or opinions of any other person or entity.

 and Semiconductors (SMH): Concerning Price Pattern?")

 and Semiconductors (SMH): Concerning Price Pattern?")


