The economy moves in cycles, from expansion to peak to recession to trough to recovery and then back to expansion again.
For anyone who remembers Economics 101 textbooks, the graphic representing these various stages was a nice wavy line that was both elegant and made the world seem so simple. Equity markets, too, pass from bull to top to correction to bear to bottom and then a bounce back into a bull.
Unfortunately, the world is not that simple and rarely f its neatly into an academic construct. Dif ferent stages can last much longer than anyone expects or be much shorter. The economic growth line can be steeper, flatter, or erratic. During each stage, there are false turning points when it appears the path has changed, but it doesn’t. Then it does change, often surprising most. And this all masks the fact that each cycle has parts of the economy that are growing or contracting at various speeds, which tend to be different each cycle.
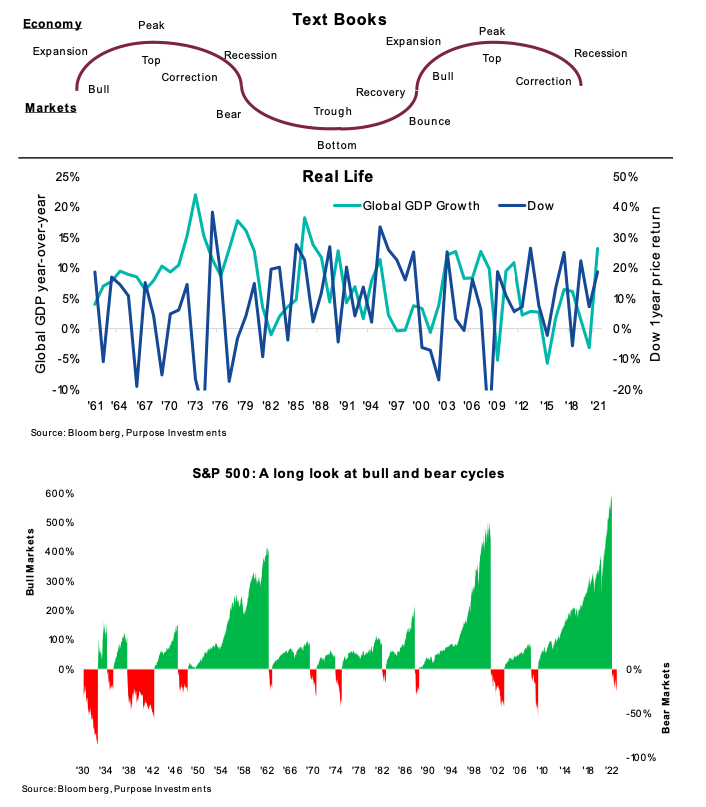
The markets also work in cycles related to the economic cycle, but it is a loose relationship.
It may be easier to view the markets as tethered to the economy, with that tether changing length at times. The economy drives corporate earnings, which does drive the stock market. Yet, at times, the valuation multiples change for various reasons. In the real world, the dynamics in the stock and bond market cycles are even more erratic than the economy, with changing leadership, internal dynamics and many more false pivots.
There is a lot of noise in the economy and the markets, but if you take a step back, there are very evident cycles. And there are clear turning points, which unfortunately only become visible well after the fact. Nonetheless, understanding which stage we are likely in now, and which is likely next, has dramatic investment implications from asset allocation to portfolio construction.
Investing is not a science – Trig, physics, and chemistry are what we would call hard sciences. The foundation of these disciplines is built on a number of proofs or laws that are constant. Investing has no hard rules, mainly because markets are the aggregate behaviour of those people willing to enter a transaction on a given day. Same with the economy – it is our behaviour. Just look at what we did to the economy when an increased percentage of us sat at home, ordered stuff on Amazon, and watched Netflix instead of drinking Aperol Spritz at Villa del Balbianello.
It is human behavior that causes both economic and market cycles. Good ideas become great ideas that attract more people or capital, and then it goes too far (we go too far). As the great idea collapses, depending on its size in the economy or market, it can also drag the rest down. Then we have a reset of expectations, and it starts all over again.
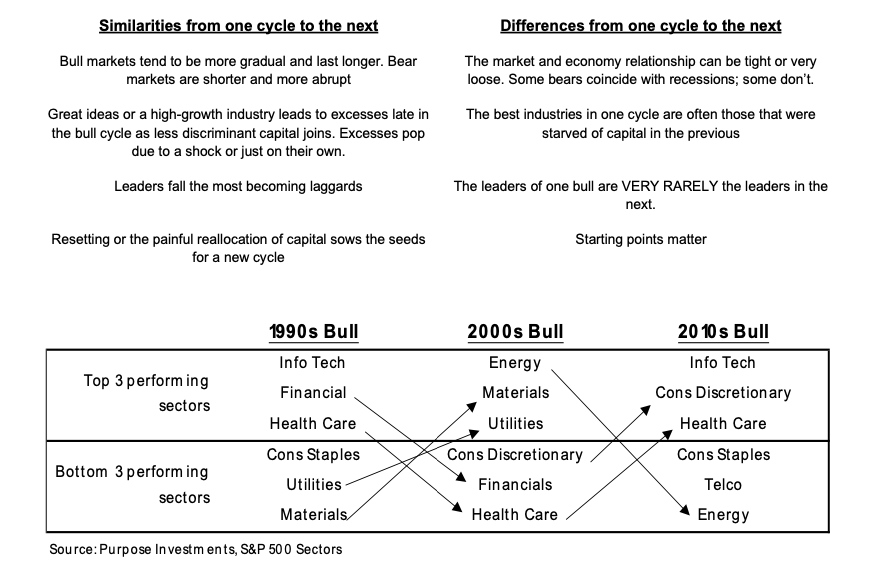
Since behaviours drive the economy and markets, this makes each cycle the same as previous cycles in some ways and different in others. Therefore, understanding what will likely be the same and what will likely be different is critical.
We cannot stress enough that the leaders in one bull cycle are VERY RARELY the leaders in the next. This is a risk as the past leaders feel comfortable as household names. Sometimes a sector may repeat as the leader, but the composition usually has changed materially from one cycle to the next. This table shows the top three and bottom three sectors in each of the past three bull cycles.
BULL CYCLES GRAPHIC
Notice how often a sector in the bottom moves to the top in the next cycle or vice versa. Two factors really contribute to this pattern – capital and starting points. A strong performing sector attracts more capital, chasing returns. This often leads to a lack of discipline and poor decisions, which takes longer than a short bear market to sort out. And starting points, the poor performers are often beaten down and become very capital responsible (out of necessity), and only the best ideas survive. This sets the stage for a higher probability of outperformance in the next cycle.
In every cycle, some things are the same, and some things are different.
Is this cycle ending?
Before we jump into what we think the next cycle will look like and discuss thoughts on portfolio construction implications, a critical question needs answering: is this cycle really ending? As we have highlighted, the turning points only become evident well after the fact; even then, there can be a debate.
The pandemic bear of 2020 – This was a bear market in equities and a recession, which does check a lot of the boxes for the end of a cycle. And it could have been if not for the monetary response to backstop markets and then the fiscal response to backstop the economy. Without those responses, the shutdowns and changed behaviours would likely have led to a severe recession that would have ended the cycle that started in March of 2009. But the stimulus prolonged the cycle, leadership didn’t change, and previous areas of excess actually accelerated.
Today – Clearly, we have a bear market, but an accompanying recession is still to be seen. So why are we confident the 13-year-old cycle is ending? Well, leadership does appear to have already changed during the bear market, as the previous leaders are being taken out. Plus, areas of excess are really starting to reverse. This is evident in everything from profitless tech and venture capital to digital assets.
It is possible the uncorking of inflation, with the accompanying rise in yields, ended this cycle. The dynamics in the market have changed. And while inflation will come back down from these levels, it does not appear that we are heading back into a super low yield disinflationary environment anytime soon.
Besides, some sort of a recession or slowing of economic activity is clearly coming. Hopefully mild, but only time will tell. Nonetheless, we think this will be enough to wash out many past excesses and start a new cycle … once the bear
is over.
Source: Charts are sourced to Bloomberg L.P., Purpose Investments Inc., and Richardson Wealth unless otherwise noted.
Twitter: @ConnectedWealth
Any opinions expressed herein are solely those of the authors, and do not in any way represent the views or opinions of any other person or entity.


 Testing Important Price Support")
")
