Okay, if we knew the answer our residence would likely be on a nice warm private island somewhere. The fact is, market advances that roll into corrections or bear markets don’t follow a pre-determined pattern or playbook.
It isn’t necessarily the Fed or monetary missteps that end a cycle, although it can be. It doesn’t have to be a slowing economy either, yet sometimes this comes after or sometimes it slows before the top. Cycles in normal times are unique, each with their own characteristics, leaders, nuances and inevitable paths. And even if there are some commonalities, can we really apply those to today’s market?
It is with nervous fingers that I type “it is different this time.” But really, with a two-year+ global pandemic, trillions in stimulus sloshing about the system, and equity markets 35% higher than before the pandemic, then when would it ever be different?
Bull runs can end for any number of reasons. Truth be told, it is after the fact that the financial narrative fills in the blanks as to what caused the bull to turn bearish. And consensus forms around the most popular or plausible narrative. This sort of rear-view analysis isn’t going to help investors much, but it does provide loads of content for those writing about the markets (present company included).
While the likely triggers that end a bull cycle vary, there are some commonalities when looking within the market itself:
1. It doesn’t happen overnight – you don’t wake up one morning and find a bull market has turned into a bear. In fact, as bull markets near their end, there is often added volatility in both directions as the bull and bear metaphorically fight it out for who will prevail. 2020 was an exception given it was caused by an exogeneous shock, but then again it remains a debate as to whether the previous bull ended or are we still in the same bull market cycle that started in 2009 (a topic for another Ethos …).
It’s normal that there is a topping pattern of some sort. So, while 2022 may be off to a wobbly start (perhaps triggered by increasing hints the Fed may become more aggressive in dialing back stimulus), given that new market highs were made so recently, this wobble shouldn’t be much of a concern (for now).
2. Change in market leadership – bull markets continue because the leaders keep making new highs. The leaders suffer some pullbacks along the way but continue to lead. Maybe that’s an oversimplification, but each bull market has leaders that are benefitting more than most because of the economy, behaviours or investor appetites. Consider technology companies in the 1990s, financial/resource companies in the 2000s and network/digital companies in the latest cycle.
At some point, the leaders falter because of a specific catalyst or simply from excess. One constant in the financial world is that when something is working, people pile in. Products/companies are created, and, inevitably, things go too far. In part, this is what drives cycles.
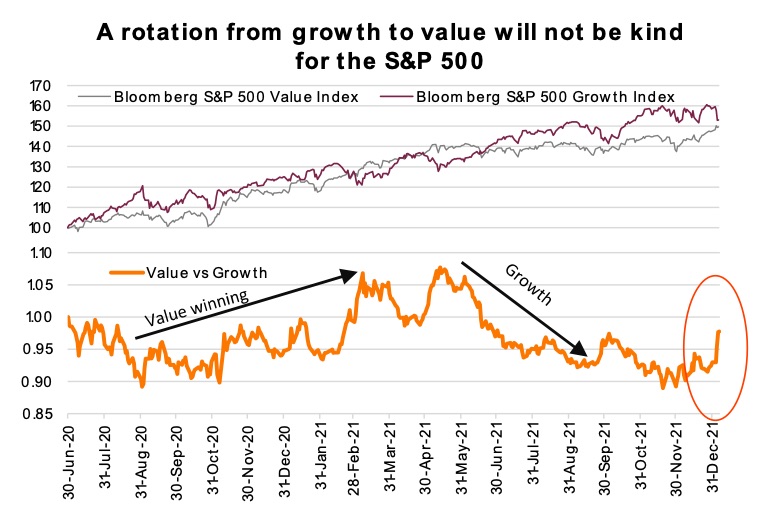
This is where things are a bit more challenging. The leaders have not been leading over the past few months, and this trend has accelerated in the early days of 2022. We all cheer value for making a bit of a comeback compared with growth—but be careful what you wish for.
A comeback for value vs growth may lead to the end of the bull, simply because value doesn’t have the weight in the index to offset a fall in growth names, referring to the S&P 500. A 5% drop in shares of Apple hit the S&P 500 much harder than the lift from a 5% rise in Bank of America. Of course, an optimist hopes for value to rise while growth pauses, as was the case in Q3 & Q4 2020, but that is not the norm.
For another potential harbinger of changing leadership, we can look down the growth spectrum. Much has been published on the performance of non-profitable technology companies. If there is a change in leadership away from tech, you could argue the non- profitable technology companies may feel the changing attitudes first, and indeed many already have. This trend is also evident in comparing the NASDAQ 100 vs the NASDAQ 100 Equal Weight. The first is a cap weighted index, so the very profitable Apple and Microsoft are 12% and 10% respectively. Equal weight, each company carries about 1%.
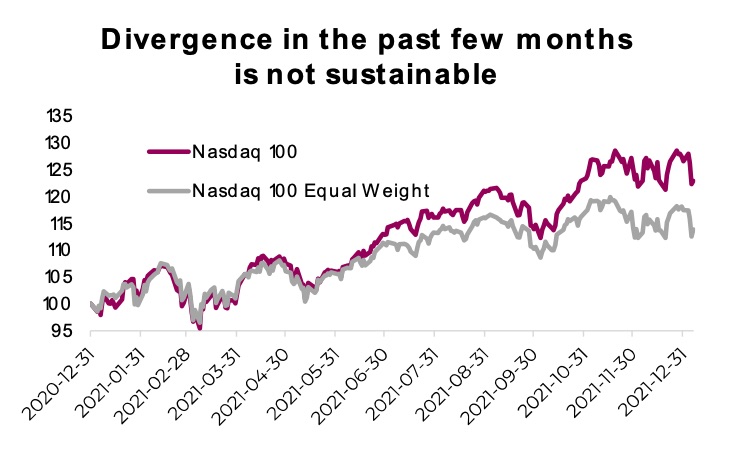
The equal weight has been flat for the past few months, as gains in the index have only been driven by those large, profitable names. This trend is exacerbated even more in the NASDAQ composite, where many more, smaller companies are included. This lack of breadth is added risk for the market and a warning that the leaders are under pressure.
Investment implications
There are certainly some concerning trends beneath the surface of the major indices, which would support a bit more of a defensive stance. This has us favouring value over growth, as the tightening cycle starts in earnest. But it is certainly premature to sound any end of cycle alarm bells on a full end of cycle. As we have noted in past Ethos’, equities can rally into the beginning of tightening cycles, and generally do have good performance in those times.
2022 is going to be a more volatile year as the market begins to absorb the changing pace and direction of monetary policy around the world. The bulls and bears are more evenly matched this year, so it is likely going to be a tussle. And it appears to have begun.
Sources: Charts are sourced to Bloomberg L.P., Purpose Investments Inc., and Richardson Wealth unless otherwise noted.
Twitter: @ConnectedWealth
Any opinions expressed herein are solely those of the authors, and do not in any way represent the views or opinions of any other person or entity.

 Testing Important Price Support")
: Cup (and Maybe Handle) Watch")

