Bitcoin crashed as the launch of the much-discussed Bakkt futures exchange was greeted with limited uptake.
Having risen to around 13,000 earlier this year, Bitcoin futures (/BTC) fell over 2000 points last week to 8075, a loss of 20%.
Bakkt is backed by the Intercontinental Exchange (ICE) and is targeting institutional clients. However, on its first day of trading only a handful of contracts traded, which may have left the market wondering if the idea is ahead of its time.
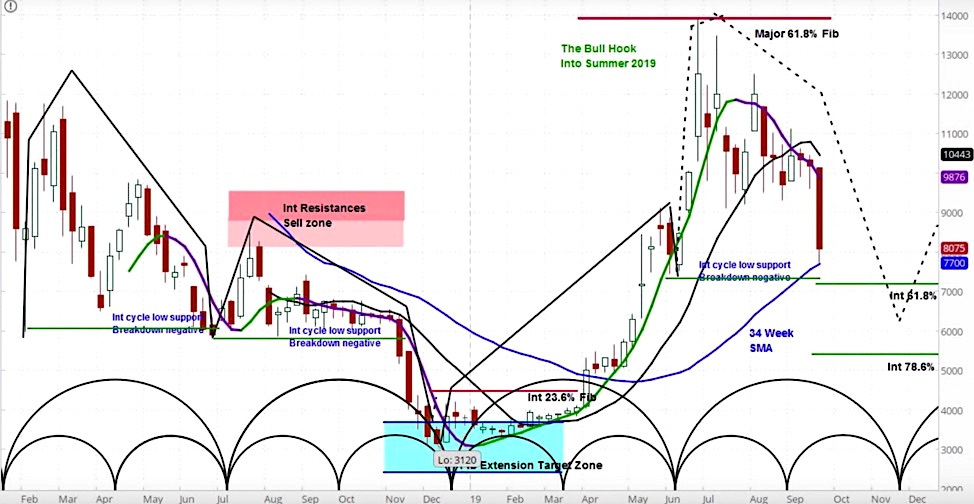
Bitcoin Futures (BTC) Weekly Chart
Our approach to technical analysis uses market cycles to project price action. The previous intermediate cycle (represented by the larger bracket) was bullishly-configured as a “right-hand translation.” This means it peaked toward the end of the cycle.
After a modest correction, the rally continued into the next cycle. However, this one appears to have peaked early in the cycle, as a bearishly configured “left-hand translation.”
Our analysis is for lower prices into November when the current intermediate cycle winds down.
Our price target is the support zone between 5400-7100.
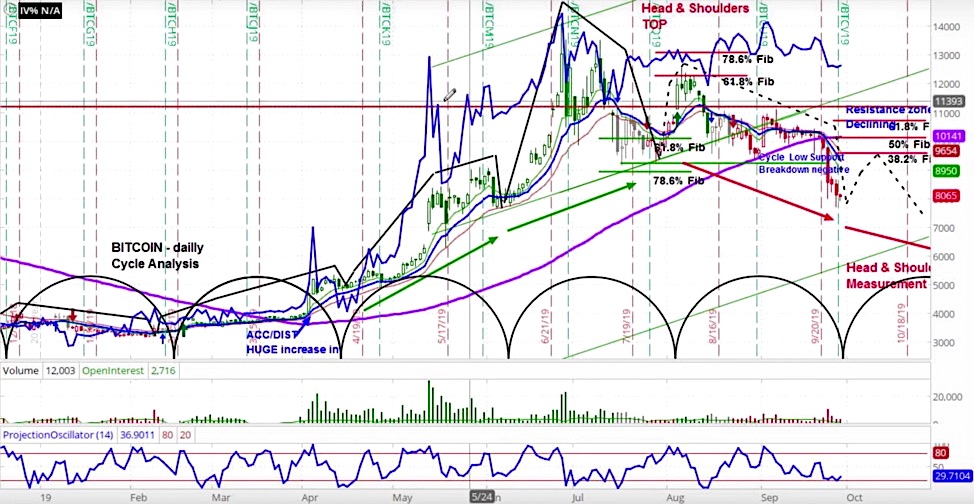
Bitcoin Futures (/BTC) Daily Chart
Looking at the daily chart, we can see that a head and shoulders pattern has formed and a breakdown has begun, as I pointed out in the latest Market Week show.
Taking a step back, the head and shoulders pattern is normally formed within the context of the market cycles. In this case, the left shoulder formed two cycles ago, the head formed in the previous cycle, and the right shoulder in the current cycle.
Given this context, we remain bearish. Yet we expect a rally as the rising phase of the next cycle begins. Our projection is for Bitcoin to fail in the Fibonacci resistance zone between 9500-10000.
For a more detailed analysis of both of these charts, check out the latest episode of the askSlim Market Week show.
Twitter: @askslim
Any opinions expressed herein are solely those of the author, and do not in any way represent the views or opinions of any other person or entity.


