A successful technical analyst once said, “Charts are the report card for your portfolio.” Want to know how well you’re doing as an investor? Simply review the charts of the stocks and ETFs in your portfolio and you’ll have the answer.
As I analyzed the stock chart of Nvidia (NVDA) this week, I was struck by how clearly the chart has rotated from a distribution phase to an accumulation phase.
And looking back, there were so many indications that there was a “change of character” in the works, indicating a dramatic change in sentiment from bearish to bullish.
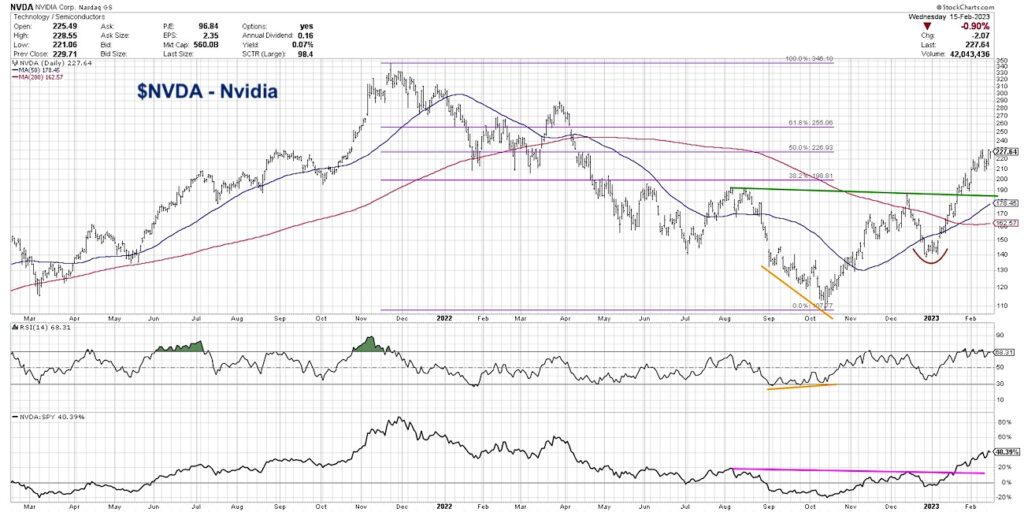
In today’s video, we’ll review the chart of NVDA and identify a series of technical indicators that generated buy signals from October 2022 through early 2023. How many of these signals did you recognize at the time? And how can you use these indicators to find better entry points in the future?
- Why are bullish divergences considered a leading indicator, and how can they help us anticipate trend exhaustion?
- How can we define a trend change from bearish phase to bullish phase?
Which techniques are more confirmational, helping us validate a reversal that has already taken place?
[VIDEO] Analyzing Nvidia’s Stock $NVDA
Twitter: @DKellerCMT
The author may have positions in mentioned securities at the time of publication. Any opinions expressed herein are solely those of the author, and do not in any way represent the views or opinions of any other person or entity.


