I have tried in both creative and straightforward ways to discuss with you how vulnerable the overall market is.
In the same way, I have tried to discuss how much opportunity lies ahead in commodities. We’ll discuss this further, along with the US Dollar, and other indicators.
In today’s market activity, we wanted to see Transportation Sector ETF (IYT) clear and close above 180.75.
Why?
That would have given it a potential reversal bottom.
We also hoped to see the Russell 2000 ETF (IWM) close above 150.00 for the same reason.
Neither happened.
Unless there is some big fundamental reason that brings in a HUGE scores of buyers, I take today’s price activity as a sign of more weakness to come.
Yet, commodities also sank today with few exceptions- wheat and gold miners.
Therefore, with the rates still on tap to hold firm, and oil prices down but holding their upward trend, the US Dollar looks like the X factor for commodities.
Is the US Dollar at a top?
The daily chart is one of UUP or the ETF that represents the dollar bull.
The blue line is the 50-DMA and the green line the 20-DMA.
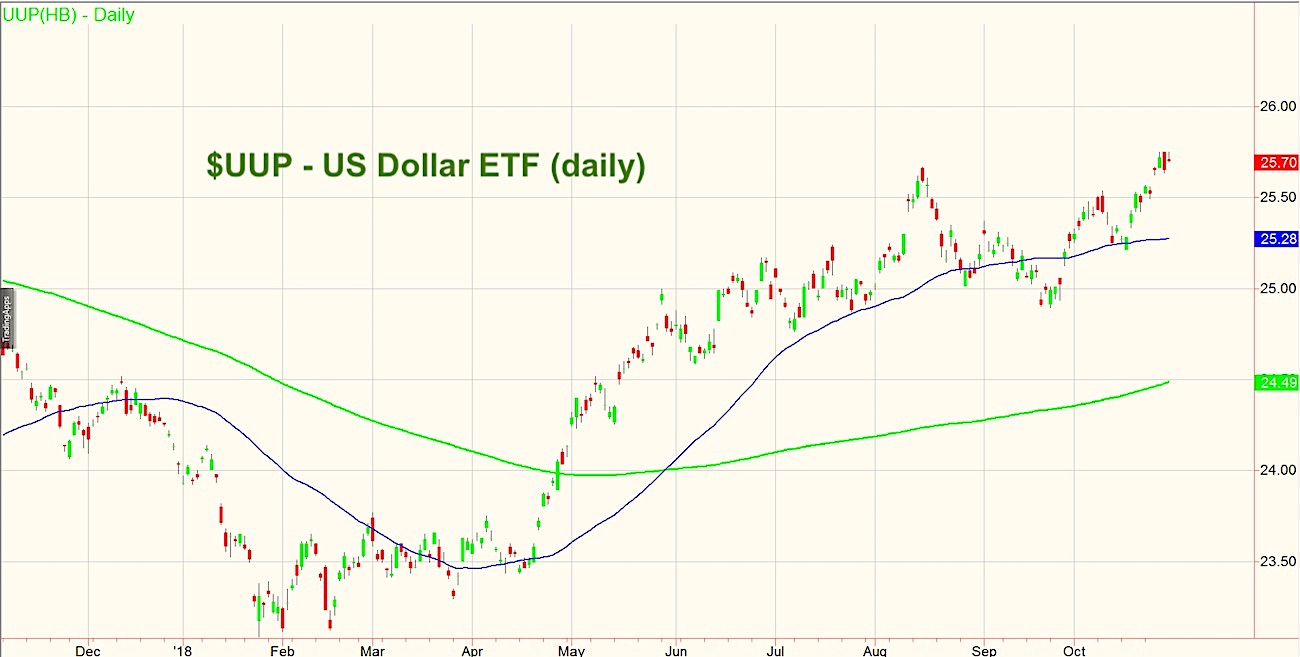
On Friday, right after the GDP number came out, the dollar rose to a new 2018 high.
Then it proceeded to sell off, closing with what looked like a bearish engulfing pattern.
Today, UUP matched Friday’s high at 25.75.
Closing with an inside day pattern (traded inside Friday’s trading range), tomorrow could be reconciliation day.
A move above 25.75 will negate any potential double top, bearish engulfing pattern or reversal top.
Yet, a move below 25.63 or Friday’s low will confirm a top.
If Tuesday, UUP closes inbetween 25.63 and 25.75, we will need a 3rdday to determine next direction.
A stronger dollar will keep us aside in adding to any commodities trades.
A confirmation top though, will spell trouble for the Federal Reserve, who is trying to make up for the years of artificially low rates.
However, it will also incite us to look more closely at buying the commodities that are already in recovery or bullish phases.
Even with the low demand at this stage of the game, the move to commodities or raw materials is a trend that is long overdue.
S&P 500 (SPY) – 257.73 the 23-month MA next support.
Russell 2000 (IWM) – Not sure I’d say this is good, but it did hold 144.70. And the tell was that it could not hold over 150
Dow Jones Industrials (DIA) – Talk about a rally into resistance-in a bear market, this happens a lot. New lows for this move-support is at 232.
Nasdaq (QQQ) – New low so now we look at 153.45 the 23-month MA support.
KRE (Regional Banks) – After 2 inside days, this got some short covering. However, the outside day candle high 53.09, could not clear.
SMH (Semiconductors) – New low on this move-80 is the next support level.
IYT (Transportation) – So much for this saving the market. Look at the monthly chart-October has wiped out all off 2018 gains
IBB (Biotechnology) – Tried but could not hold the rally-now we look at 100.22 the 2018 low
XRT (Retail) – 44.50-45.00 big support-still above the 23-month MA.
Note that you can get daily trading ideas and market insights over on Market Gauge. Thanks for reading.
Twitter: @marketminute
The authors may have a position in the mentioned securities at the time of publication. Any opinions expressed herein are solely those of the author, and do not in any way represent the views or opinions of any other person or entity.


