Much is written daily about exchange traded funds (ETFs) as they continue to grow in popularity and are increasingly becoming the vehicle of choice for investment portfolios.
There are now roughly 2,000 ETFs listed in the U.S. and there are multiple funds covering any given financial market index, asset class, sector, sub-sector, or investment strategy. S&P 500, check. Gold, check, Crude Oil, check. Treasury bonds, check. And the list goes on, with several competing funds and niche offerings.
Zeroing In
When constructing an investment portfolio it is not enough to understand a client’s situation, various nuances of asset classes, fund expense ratios, and the like.
It is also critical to understand how any investment vehicle is structured as this will have a significant impact on the portfolio’s performance.
Analyzing investment vehicles like ETFs and dissecting their structure is obviously a very important part of what we do for our clients.
One of the tools we rely on throughout this process is a simple ratio chart. In our opinion these are very effective in allowing us to quickly gauge how a particular fund is structured, how well it tracks the underlying benchmark, and whether it is suitable for any client portfolio.
For those not familiar with ratio charts, they are derived by dividing two series of numbers and plotting the results.
When evaluating funds we take the prices of an ETF over time and divide them by the prices of the index it is supposed to track. Analyzing the resulting chart gives us the ability to clearly see how well the fund does its job over time.
Having looked at hundreds of funds and associated ratios, we would classify them into three categories.
- Investment Grade
- Speculative (or “Junk”)
- Weapons of Mass Wealth Destruction
In constructing well-diversified long-term portfolios we would only use funds from the first category.
Funds that fall in the latter two categories are only suitable for short-term trading in our opinion. Even then they should be used with extreme caution as we try to explain below.
Investment Grade
The best example of an “investment grade” ETF is arguably the granddaddy of all ETFs: SPDR S&P 500 ETF (SPY). It was the first ETF ever listed in the U.S. in the early 1990s. As the name suggests, it is designed to track the S&P 500 index.
SPY is structured in a very simple way: it owns every stock in the S&P 500 Index. When the index changes, so does SPY. When underlying stocks pay dividends, these are accrued and then paid out to SPY holders.
Looking at the ratio chart of SPY vs. S&P 500 Index it is clear that this fund has done a remarkable job tracking the underlying index over the past 20 years.
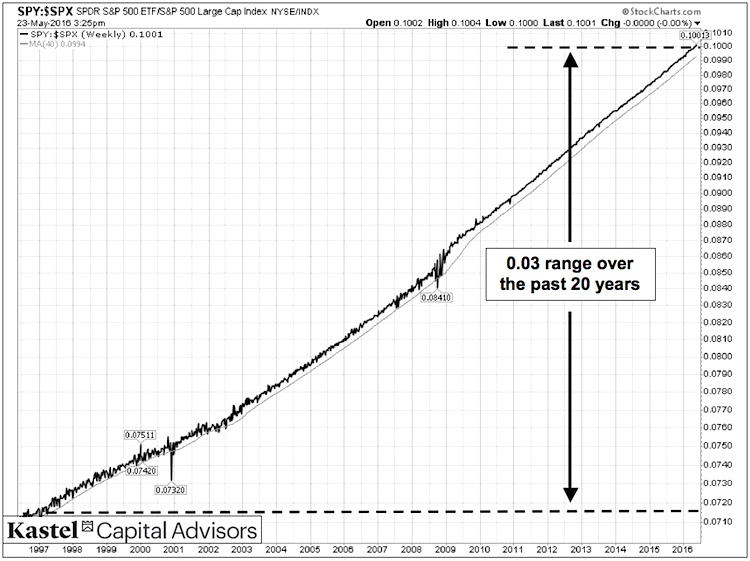
The ratio chart looks like a straight line ascending at around 45 degrees. The rising line would suggest that SPY continually outperforms the underlying index. In reality, this effect is exaggerated because of the chart’s scaling and given how dividends are accounted for and compounded.
The key point to note is that, over the last 20 years, the ratio of SPY to the S&P 500 index has moved in an extremely narrow 0.03 range.
There are also very good examples of investment grade funds in the fixed income world.
First bond ETFs appeared some 10 years after SPY. Similarly to SPY, the best bond ETFs are the ones that directly own a basket of bonds of certain characteristics (duration, quality, etc.)
One such fund is the iShares 7-10 Year Treasury bond ETF (IEF).
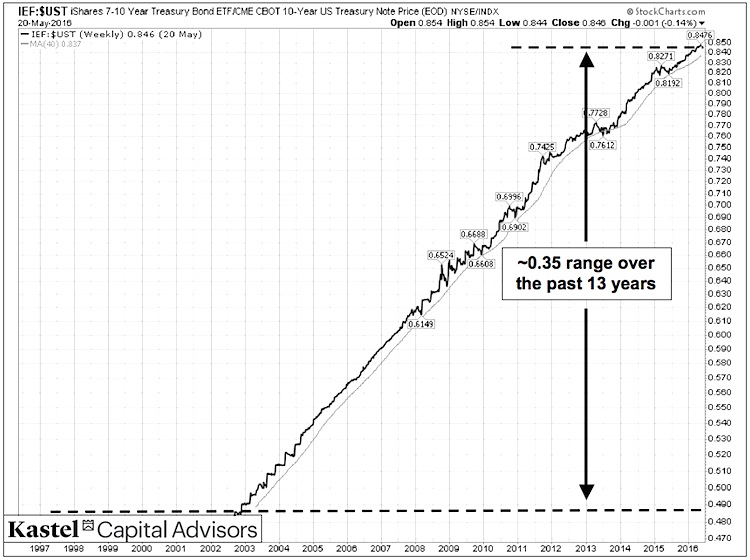
This ratio has also risen in an almost straight line since the fund’s inception, essentially for the same reasons as SPY’s.
The fund’s ratio has also stayed in a remarkably stable and narrow 0.35 range over this time period, meaning that the fund’s structure allows it to track the underlying index very effectively.
Speculative – “Junk”
Funds in this category typically have important structural differences from the investment grade funds.
Instead of directly owning the assets in the underlying benchmark, these funds usually rely on derivative products like futures and options contracts.
While the use of derivatives certainly has its place in investing, using them in the long-term portfolio context creates serious performance issues.
Most publicly traded derivative contracts come with predefined expiration dates. As expiration dates near, value of most contracts steadily declines even if the underlying asset class prices are not moving at all, creating an adverse drag on fund performance.
Making matters worse, funds that use derivatives have to continually replace expiring contracts with fresh ones, which imposes an additional ongoing cost and exacerbates the performance drag.
Best examples of ETFs in this category are in the commodity space, including one of the oldest commodity funds: United States Oil Fund (USO).
The long-term ratio chart of this fund to its underlying benchmark (West Texas Intermediate Crude Oil) makes the above structural issues immediately clear.
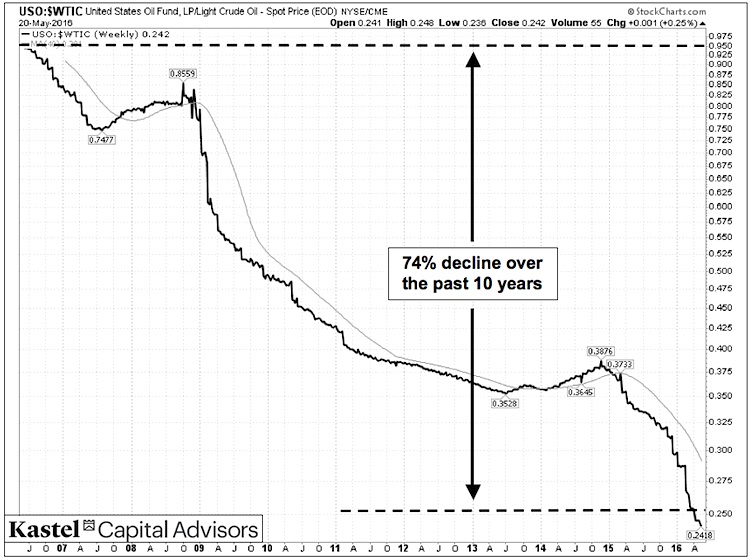
Unlike the investment grade ETFs, the above chart shows a steady and significant long-term decline.
Given the adverse impact of time on derivative contracts in the portfolio, USO is unable to adequately track the underlying commodity and the slope of the ratio chart shows a continual destruction of value and investor dollars over time.
To translate what the above ratio chart is saying into layman’s terms, if you invested $100 dollars into USO 10 years ago, today your investment would be worth roughly $26, EVEN IF the price of oil didn’t move a penny over this time.
This explanation was intentionally over-simplified.
More realistically, the price of oil did move significantly over this time, of course. When USO was introduced in 2006 both the fund and the West Texas Intermediate Crude oil were trading around $70.
Currently, USO trades around $11.50, some -83% lower, while the WTIC crude oil trades around $48 (“only” -30% lower). The difference between these two percentage numbers is essentially the massive long-term performance drag suffered by USO due to its use of derivatives.
The long-term destruction of value is even more severe with USO’s cousin, the widely used United States Natural Gas Fund (UNG).
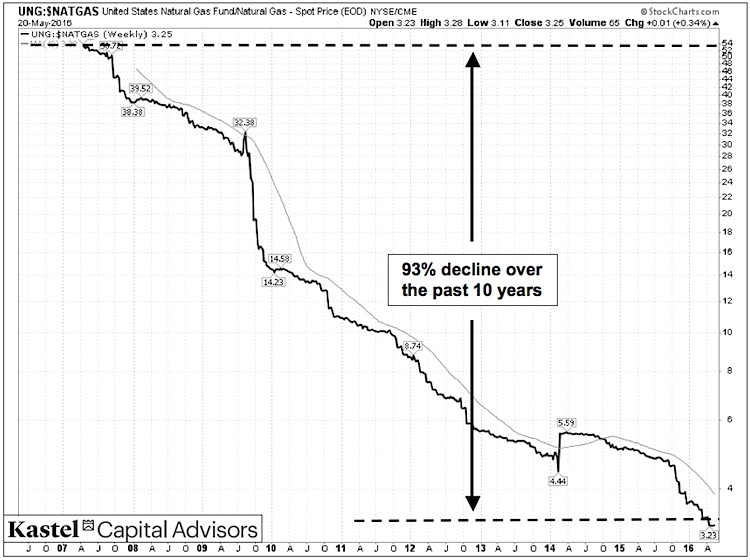
This ratio has declined more than 90% over the last 10 years, making UNG and other similarly structured ETFs utterly unsuitable for use in any long-term portfolio, regardless of the trend of any underlying asset class.
Weapons Of Mass (Wealth) Destruction
This category takes the wealth destruction to a whole new level.
Most investors are probably familiar with “leveraged” ETFs, whose objective is to boost the daily returns of an underlying index by some pre-determined factor (e.g. 2x or 3x).
To accomplish this, these ETFs also need to rely on derivatives, the use of which, as we have seen, results in a steady destruction of value. The “leveraged” aspect of these funds serves to accelerate the destruction in magnitude as well as time.
To be clear, there is no “Wall Street conspiracy” or attempt at deception here. Every provider of leveraged ETFs will be the first to tell you that these products are absolutely not suitable as investment products and are clearly aimed at short-term traders.
However, this message seems to get lost out there. We have had conversations with more than a few investors who think leveraged ETFs offer a decent way to juice long-term returns.
The first example is a popular leveraged ETF in the miner space: Direxion Daily Gold Miners Index Bull 3x (NUGT). As the name implies, this ETF attempts to achieve “three times” the daily return of the underlying index of gold mining stocks (NYSE Arca Gold Miners Index – GDM).
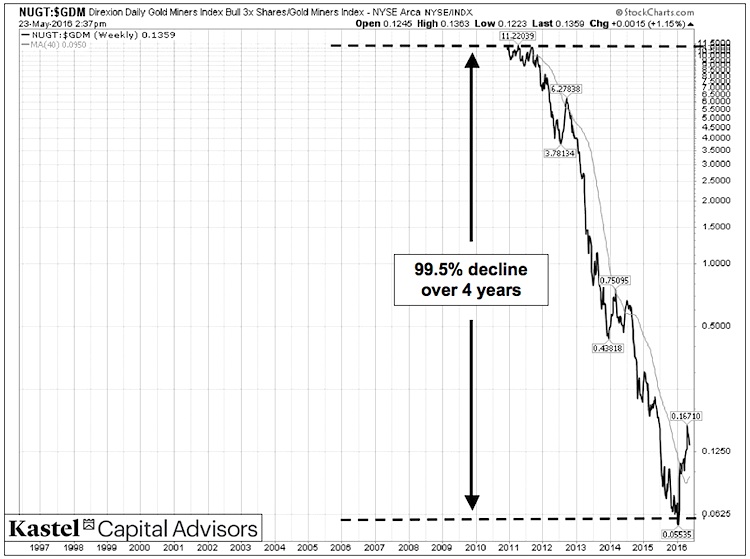
The ratio chart clearly shows the massive destruction of value, which is as severe (-99.5%) as it is accelerated, occurring in about four years.
The final example we will use is the VelocityShares 3x Long Crude Oil ETN (UWTI), which attempts to achieve three times the daily return of WTI crude oil.
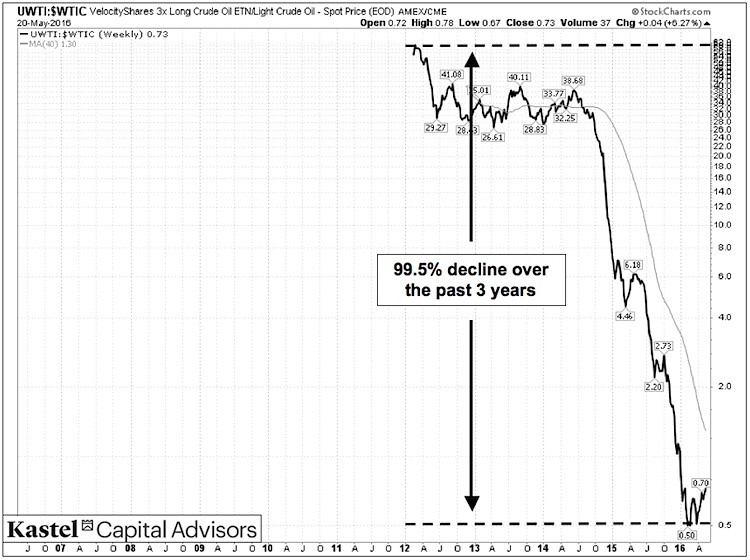
The combination of derivatives and leverage makes the -99.5% decline in the ratio happen even faster, in about three years.
A Few Words for Traders
Even short-term traders need to exercise caution when using speculative or WMWD funds.
It should be obvious that the potentially accelerated loss of value in leveraged funds makes risk management extremely important.
Aside from this, the biggest mistake we see traders make is when they apply full blown technical analysis to derivative ETFs in an attempt to identify potential pivot points or support and resistance levels.
This leads to wrong results and wrong trading signals and decisions because derivative ETFs track an underlying asset very poorly. Consequently, their price structure is inevitably a severely distorted picture of reality.
Trying to perform technical analysis on a derivative ETF will yield similar (and wrong) results to doing technical analysis of equity put or call options.
Proper technical analysis should only be performed on an underlying index like GDM, even if one is “trading” a derivative/leveraged fund like NUGT (or DUST).
Conclusion
The proliferation of ETFs has resulted in significant long-term benefits for investors.
However, their abundance also demands caution and understanding how they are structured before putting them in your portfolio.
As we have seen above, long-term investors are best off focusing on simple and liquid ETFs that own tangible assets like stocks and bonds and have clearly demonstrated a long-term ability to effectively track the underlying index or benchmark.
Funds that are structured using derivatives have no place in a diversified long-term portfolio mostly because of the substantial drag on performance.
Finally, even short-term traders should approach derivative ETFs with caution.
Thanks for reading.
Please Note: Absolutely NOTHING in this article should be considered as investment advice or recommendation regarding the suitability of any investment. For more information please refer to Disclosures.
Also read: Investing Fees & Expense: The Logic Of Numbers
Twitter: @KastelCapital
Any opinions expressed herein are solely those of the author, and do not in any way represent the views or opinions of any other person or entity.

: Showing Some Signs of Emerging Strength")
