This week has been a very bad week for Financials – big banks, regional banks, insurers, reinsurers… But the truth is, both the KBE Regional Banking ETF (NYSEARCA:KRE) and the broader KBE Bank Index ETF (NYSEARCA:KBE) are down 17% since March.
At LaDucTrading, we have been swing short banks (via the XLF put spreads) a month now.
Practically every day in my LIVE Trading Room I am asked what I think about banks and every day I answer pretty much the same way: “I trust them as far as I can throw them” which is just my way of not allowing the incessant bank deregulation blather and constant Unusual Option Activity in calls for these institutions to sway me.
My #1 Premise: I see banks as correlated to yields and I believe the 10-Year U.S. Treasury Yield (TNX) has a destiny with its 1.87% Gap Fill. This thesis and sector call was long before Harvey and Irma caused a major sell-off in reinsurers and before the delaying of the Debt Ceiling or ECBs statement today for continued QE. But all of these events have helped fuel a rally in Gold and Bonds that have triggered even lower yields and with it the break-down in banks – i.e. the Financial Sector ETF (NYSEARCA:XLF) fell below its 200 day moving average for the first time in a year.
XLF Financial Sector Chart
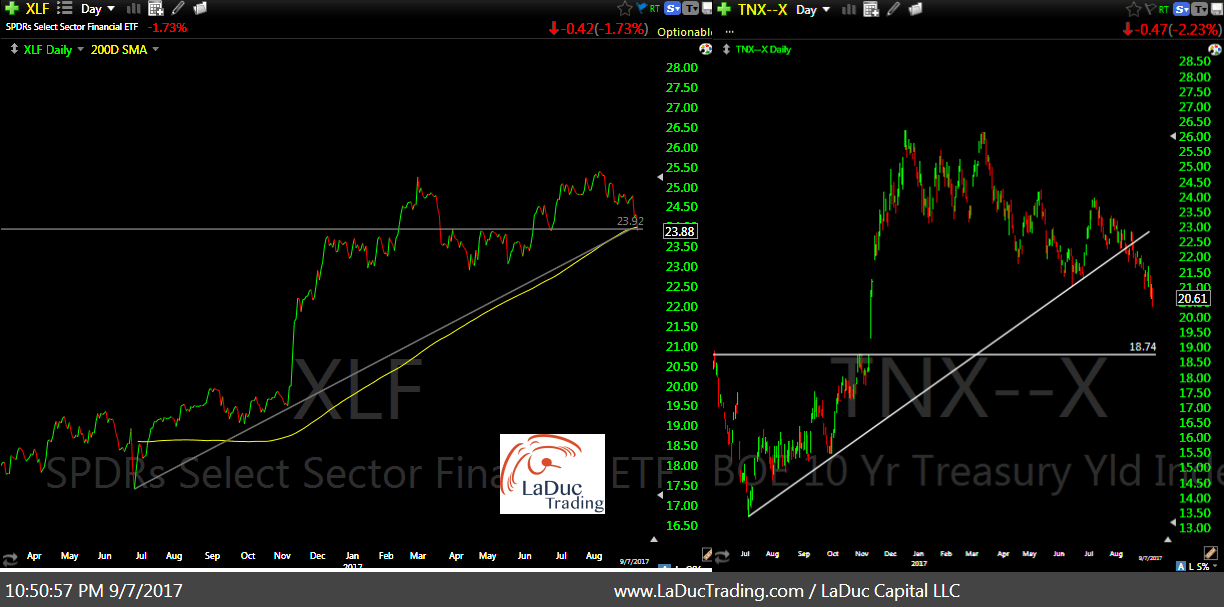
With XLF down 7% from its failed breakout on August 8th, our trade to keep shorting banks on every bounce has clearly worked. Now that XLF is on three levels of support but yields not yet at their ‘price target’, do I think it’s all clear to go long banks? Under normal circumstances (and there is nothing normal about our current circumstances), I would say it’s time for a sizeable bank bounce, but with fiscal brinkmanship postponed rather than resolved (Debt Ceiling, ECB, Fed Chair), perhaps the bank sell-off is a warning.
I think it’s more than plausible banks will fail here in the coming weeks and are at risk of retracing all the way down to where the Trump Reflation trade took off in November ~$19 for XLF, along with yields. The question I have is how soon now that everyone sees yields breaking down and banks collapsing. Will shorting banks become a crowded trade at which point the point of reversal will be a likely bottom. But first, rates must bottom and I will keep shorting banks until I see signs of yields stabilizing and reversing.
While we play the bear market occurring in Banks/Insurers, it’s time to take a close look at another short theme that looks to rhyme: S&P Barra Value Index: IVE. I use the IVE in my intermarket analysis, often to compare against the growth ETF “IVW”. I find the ratio between them to help my general market and sector analysis.
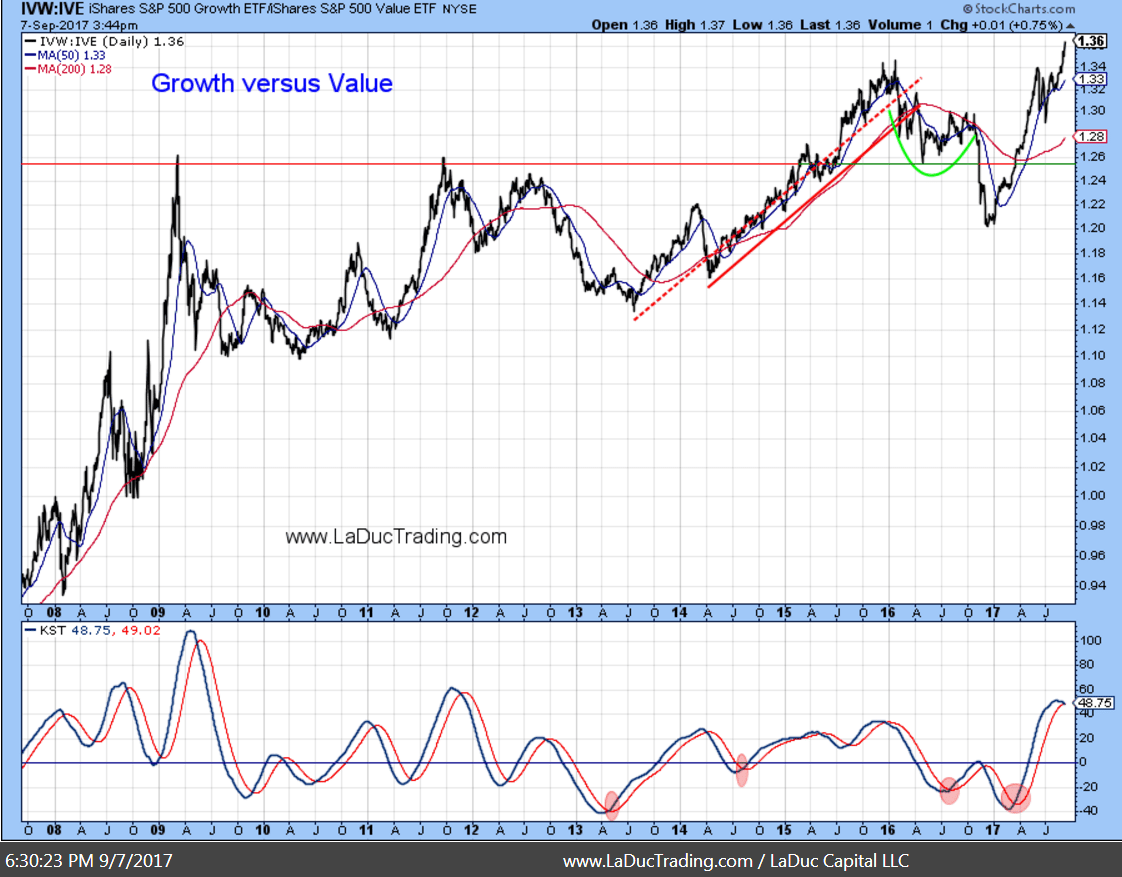
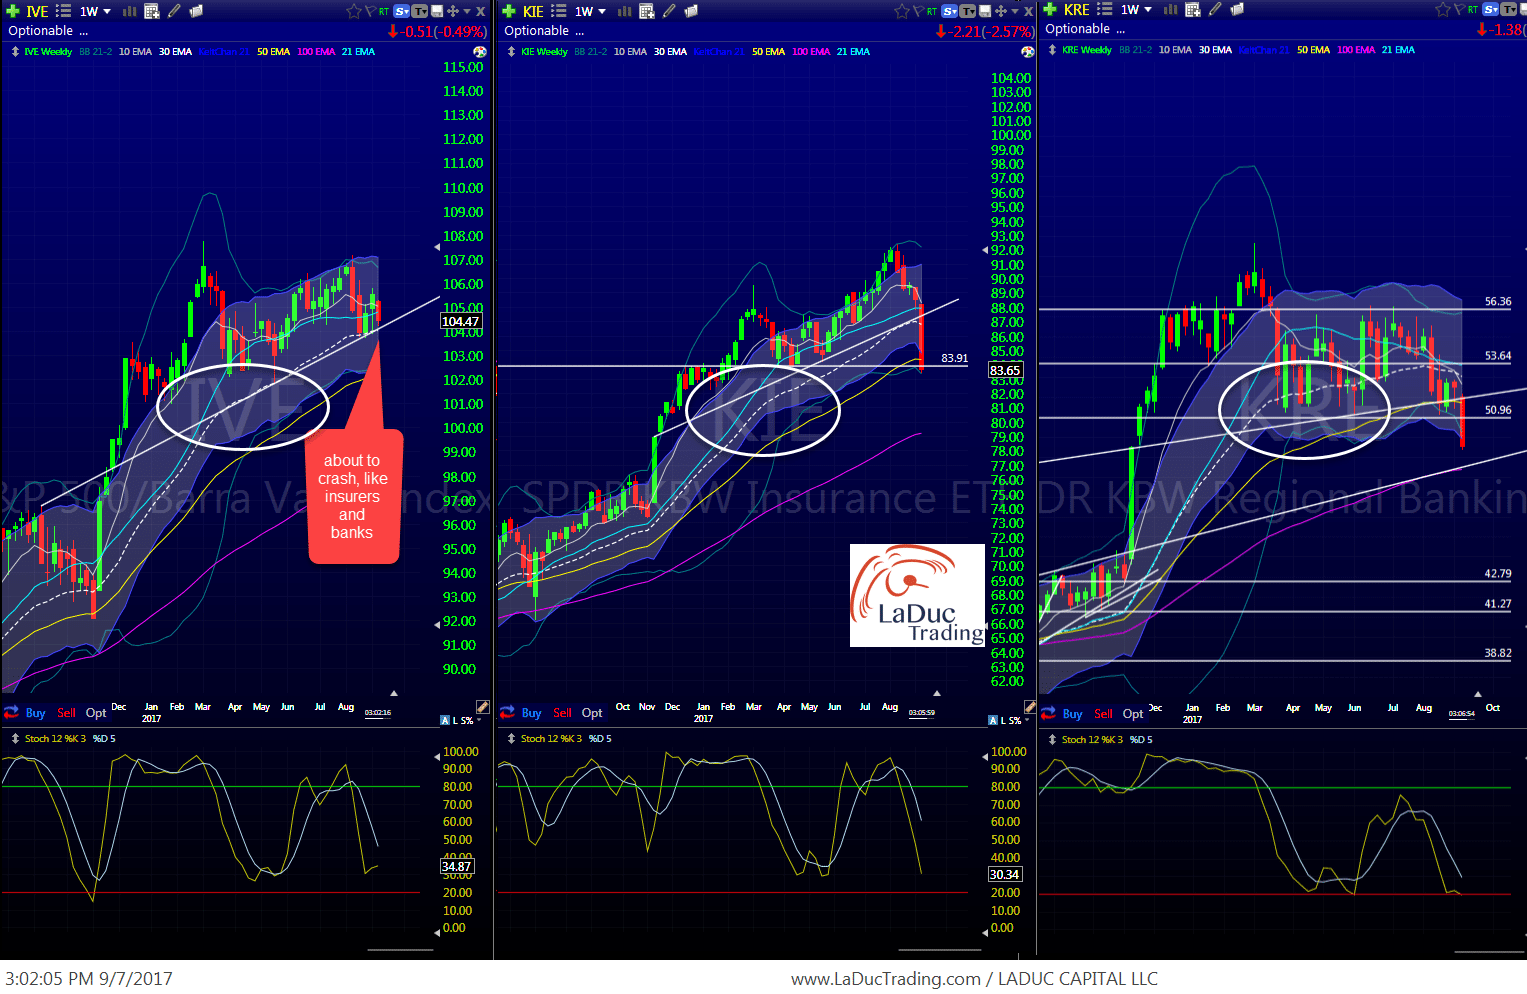
It would appear the growth:value ratio is starting to peak and potentially roll over, but there is something in the IVE chart itself that causes me to look deeper. Can you see the recurring pattern when I put IVE (value), KIE (insurance sector), KRE (regional banks) side-by-side? (It also strikes the same pattern as XLF above.) For me it’s clear, IVE is about to roll over like XLF, KRE, KIE and I want to be positioned for it for my clients.
Which companies within this value index are most likely to push it over the line and become a value trap?
I will be picking my spots–both trading vehicles and trade set ups–and sharing with Clients.
Come join me… I made it super easy for you to pop into my LIVE Trading Room for custom analysis and interaction–any time! You choose when to fish: Trade the Open or the Close, make a day of it or stay for the whole month.
Twitter: @SamanthaLaDuc
Any opinions expressed herein are solely those of the author, and do not in any way represent the views or opinions of any other person or entity.


